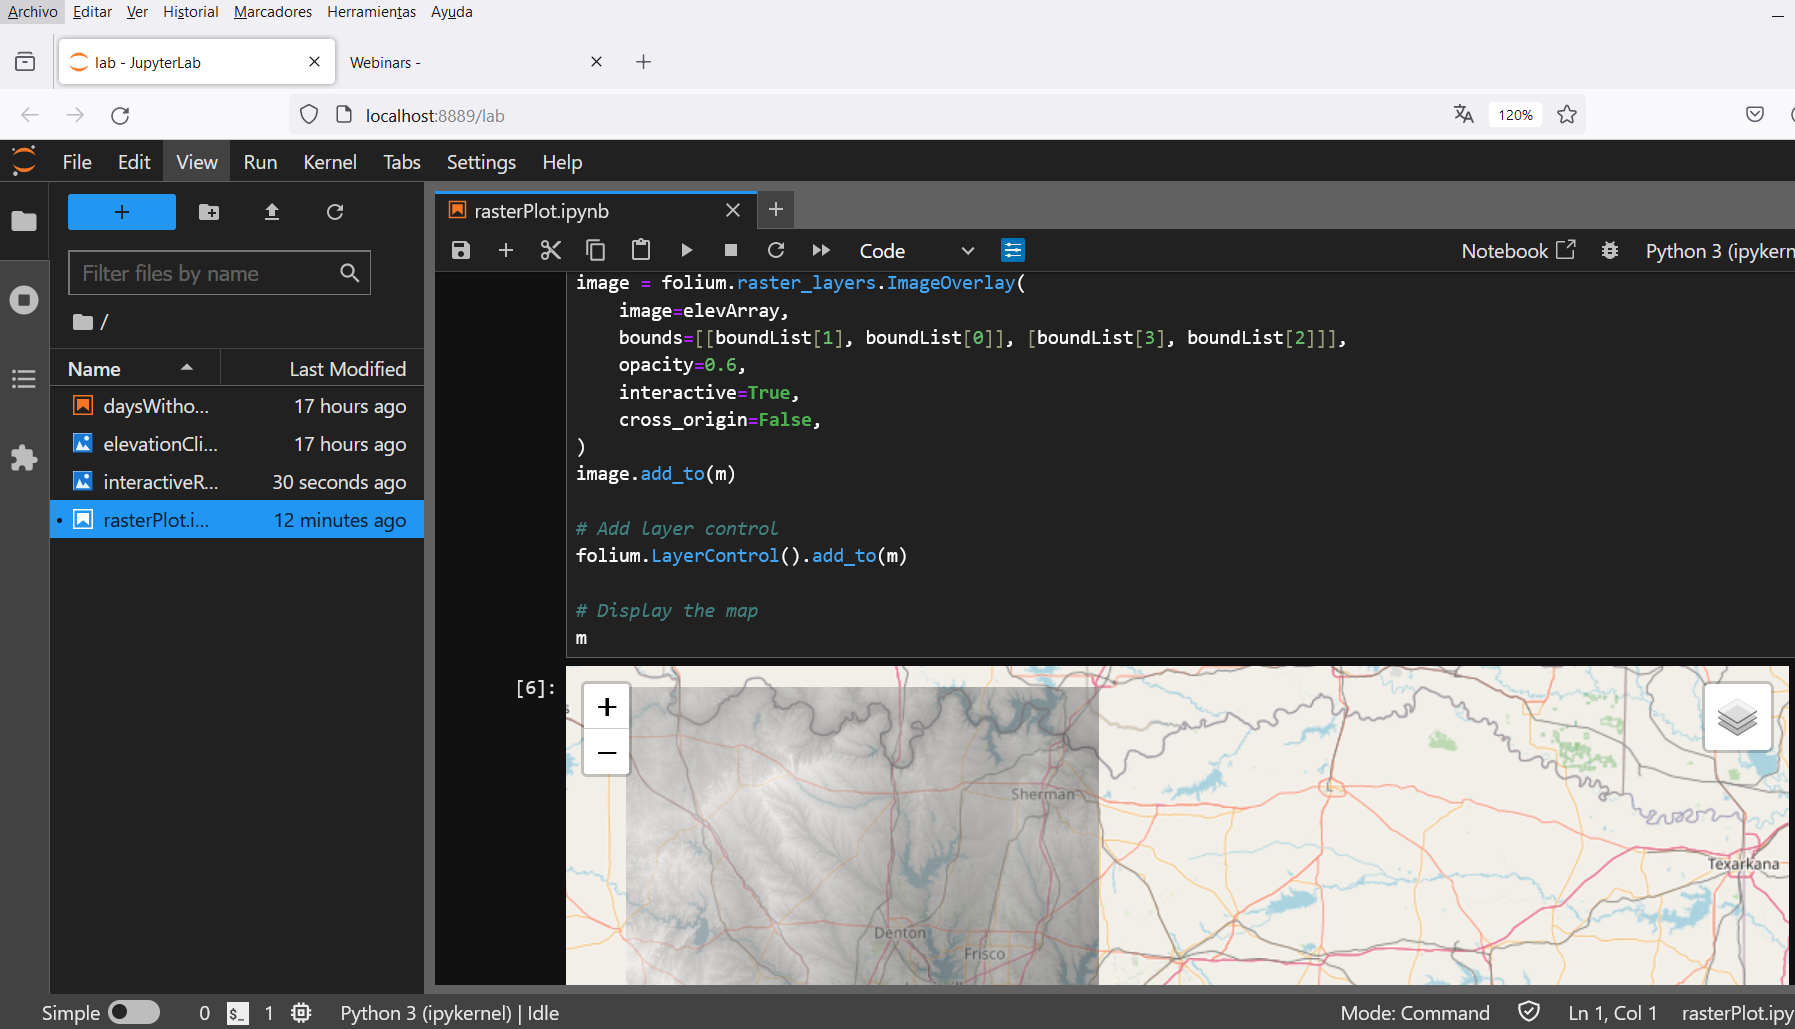
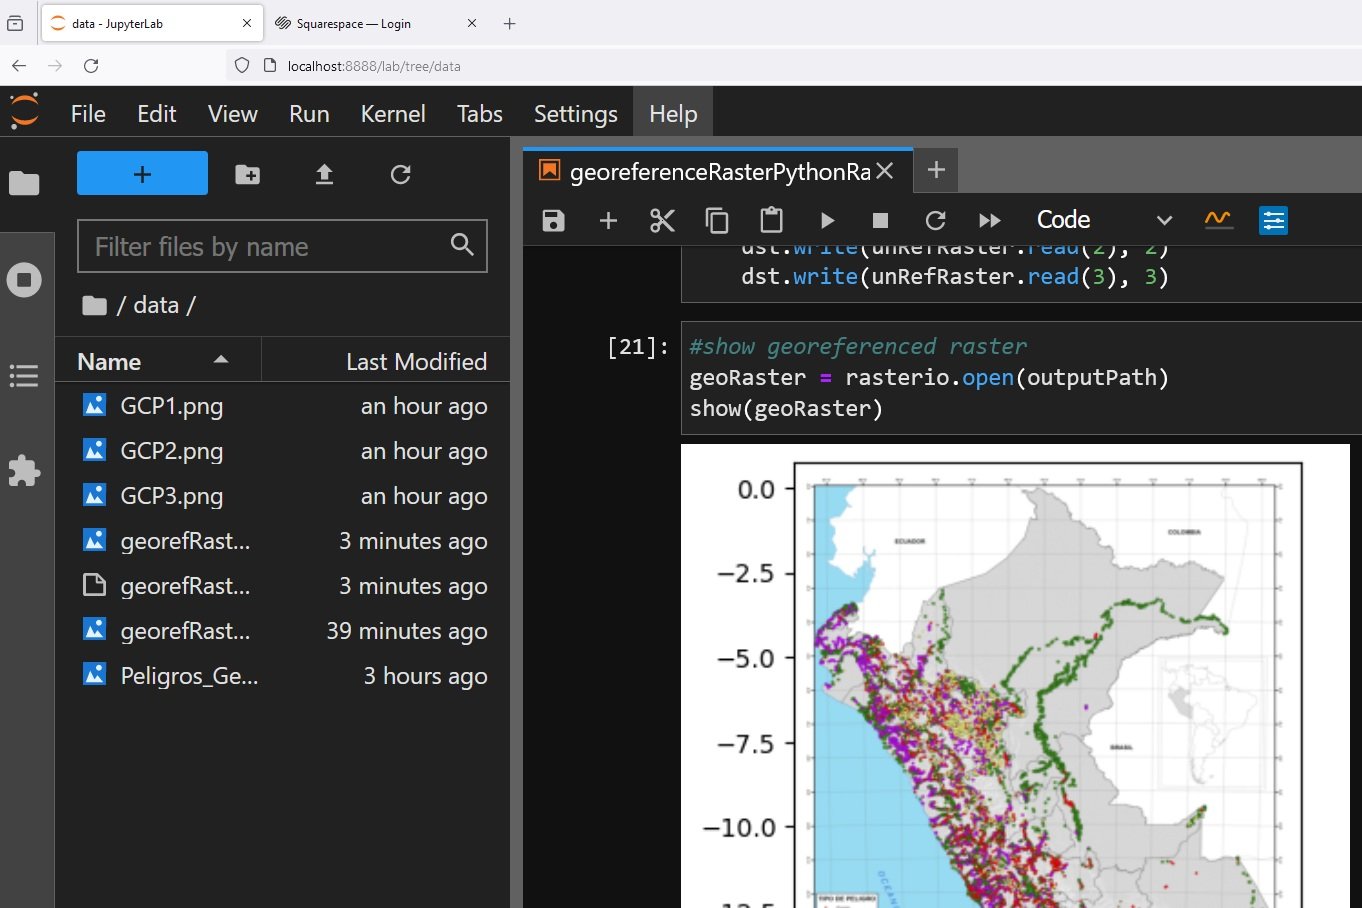
Otro tutorial realizado bajo el concepto de “Python geoespacial”. El tutorial muestra el procedimiento para ejecutar una interpolación Scipy sobre un dataframe de Pandas de datos puntuales que tienen una matriz Numpy 2D como salida del proceso. Con algunos procedimientos de Rasterio, la matriz Numpy se transformó en un ráster Tiff geoespacial monobanda.
Tutorial
Código
import numpy as np
import pandas as pd
from scipy.interpolate import griddata
import matplotlib.pyplot as plt
import rasterio
#open the chemistry data
chemData = pd.read_csv('../tab/chemistryData.csv',index_col=0,usecols=[0,5,6,18])
chemData = chemData.dropna() #delete missing data rows
chemData.describe()| EsteCor | NorteCor | pH | |
|---|---|---|---|
| count | 176.000000 | 1.760000e+02 | 176.000000 |
| mean | 247362.431818 | 8.352024e+06 | 8.070892 |
| std | 5246.316476 | 7.225883e+03 | 0.877716 |
| min | 236536.000000 | 8.336049e+06 | 5.630000 |
| 25% | 242377.750000 | 8.346304e+06 | 7.617500 |
| 50% | 249067.000000 | 8.352004e+06 | 8.045000 |
| 75% | 251132.000000 | 8.356741e+06 | 8.510000 |
| max | 259877.000000 | 8.372586e+06 | 10.400000 |
# Optional : drop extreme values
chemData = chemData[chemData.pH > np.quantile(chemData.pH,0.1)]
chemData = chemData[chemData.pH < np.quantile(chemData.pH,0.9)]
chemData.describe()| EsteCor | NorteCor | pH | |
|---|---|---|---|
| count | 140.000000 | 1.400000e+02 | 140.000000 |
| mean | 247838.157143 | 8.352633e+06 | 8.076693 |
| std | 5230.177137 | 7.042238e+03 | 0.489108 |
| min | 236536.000000 | 8.336049e+06 | 7.100000 |
| 25% | 243042.750000 | 8.347914e+06 | 7.790000 |
| 50% | 250146.000000 | 8.353390e+06 | 8.055000 |
| 75% | 251441.250000 | 8.357699e+06 | 8.370000 |
| max | 259877.000000 | 8.372586e+06 | 9.330000 |
#define interpolation inputs
points = list(zip(chemData.EsteCor,chemData.NorteCor))
values = chemData.pH.values
print(points[:5])
print(values[:5])
[(250901.0, 8342712.0), (244329.0, 8346119.0), (244329.0, 8346119.0), (244329.0, 8346119.0), (240476.0, 8351811.000000001)]
[8.03 8.96 7.8 8.04 8.17]#define raster resolution
rRes = 50
#create coord ranges over the desired raster extension
xRange = np.arange(chemData.EsteCor.min(),chemData.EsteCor.max()+rRes,rRes)
yRange = np.arange(chemData.NorteCor.min(),chemData.NorteCor.max()+rRes,rRes)
print(xRange[:5],yRange[:5])[236536. 236586. 236636. 236686. 236736.] [8336049. 8336099. 8336149. 8336199. 8336249.]#create arrays of x,y over the raster extension
gridX,gridY = np.meshgrid(xRange, yRange)
#interpolate over the grid
gridPh = griddata(points, values, (gridX,gridY), method='linear')#show interpolated values
plt.imshow(gridPh)#definition of the raster transform array
from rasterio.transform import Affine
transform = Affine.translation(gridX[0][0]-rRes/2, gridY[0][0]-rRes/2)*Affine.scale(rRes,rRes)
transformAffine(50.0, 0.0, 236511.0,
0.0, 50.0, 8336023.999999999)#get crs as wkt
from rasterio.crs import CRS
rasterCrs = CRS.from_epsg(32718)
rasterCrs.data{'init': 'epsg:32718'}#definition, register and close of interpolated raster
interpRaster = rasterio.open('../rst/interpRaster3.tif',
'w',
driver='GTiff',
height=gridPh.shape[0],
width=gridPh.shape[1],
count=1,
dtype=gridPh.dtype,
crs=rasterCrs,
transform=transform,
)
interpRaster.write(gridPh,1)
interpRaster.close()Datos de entrada
Puede descargar los datos de entrada desde este enlace.

