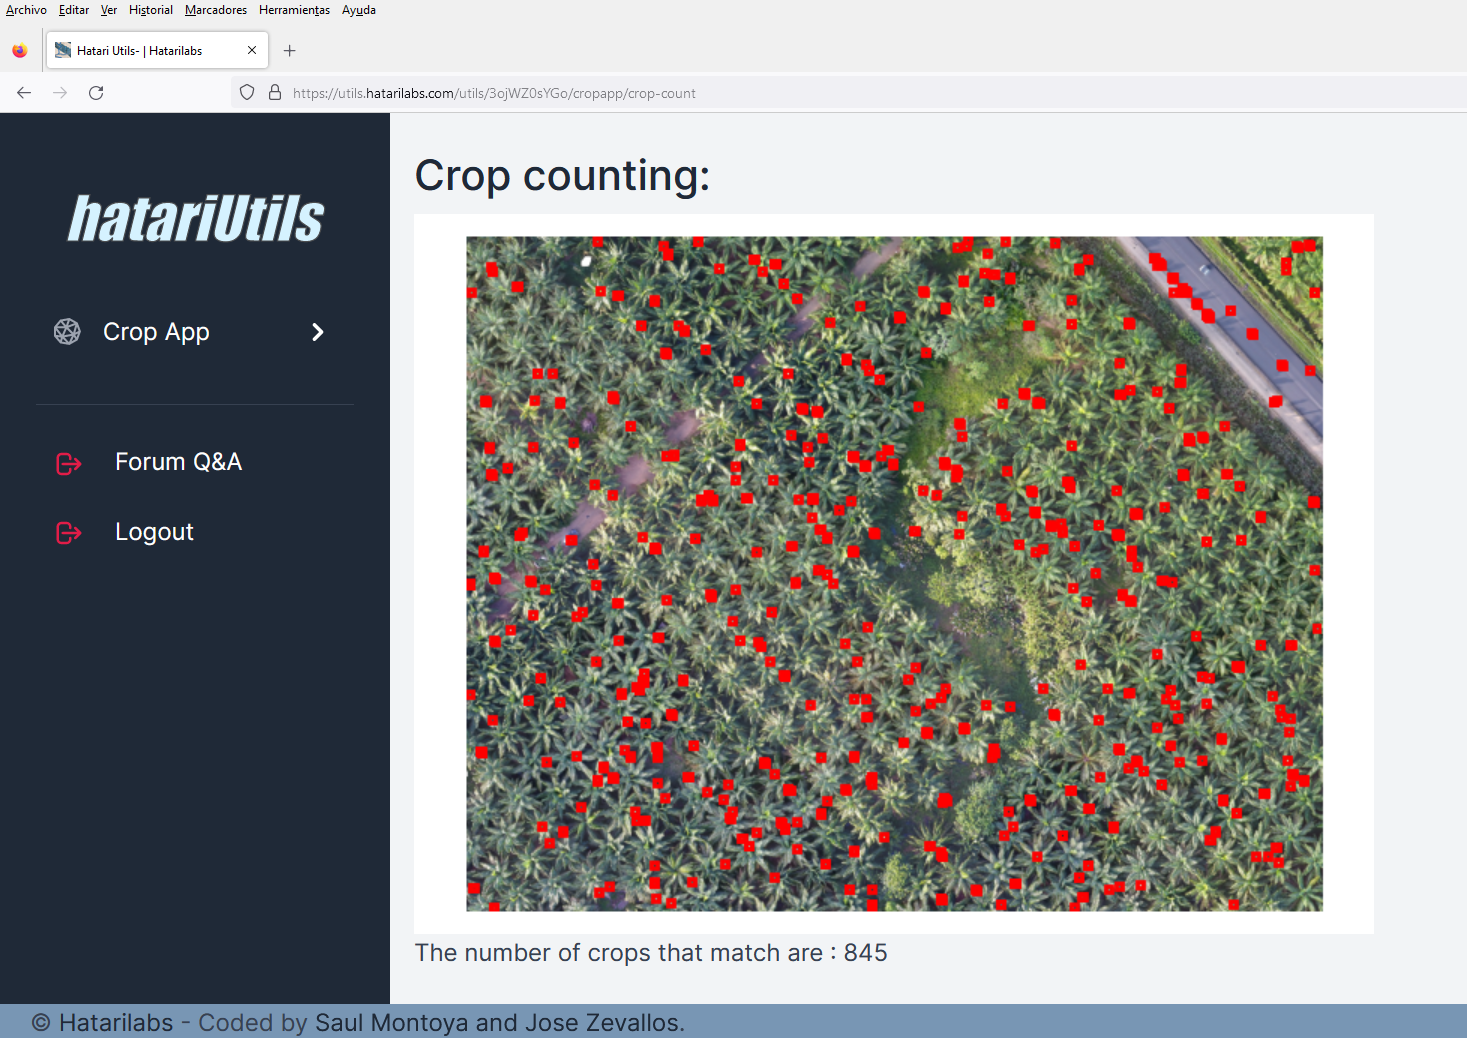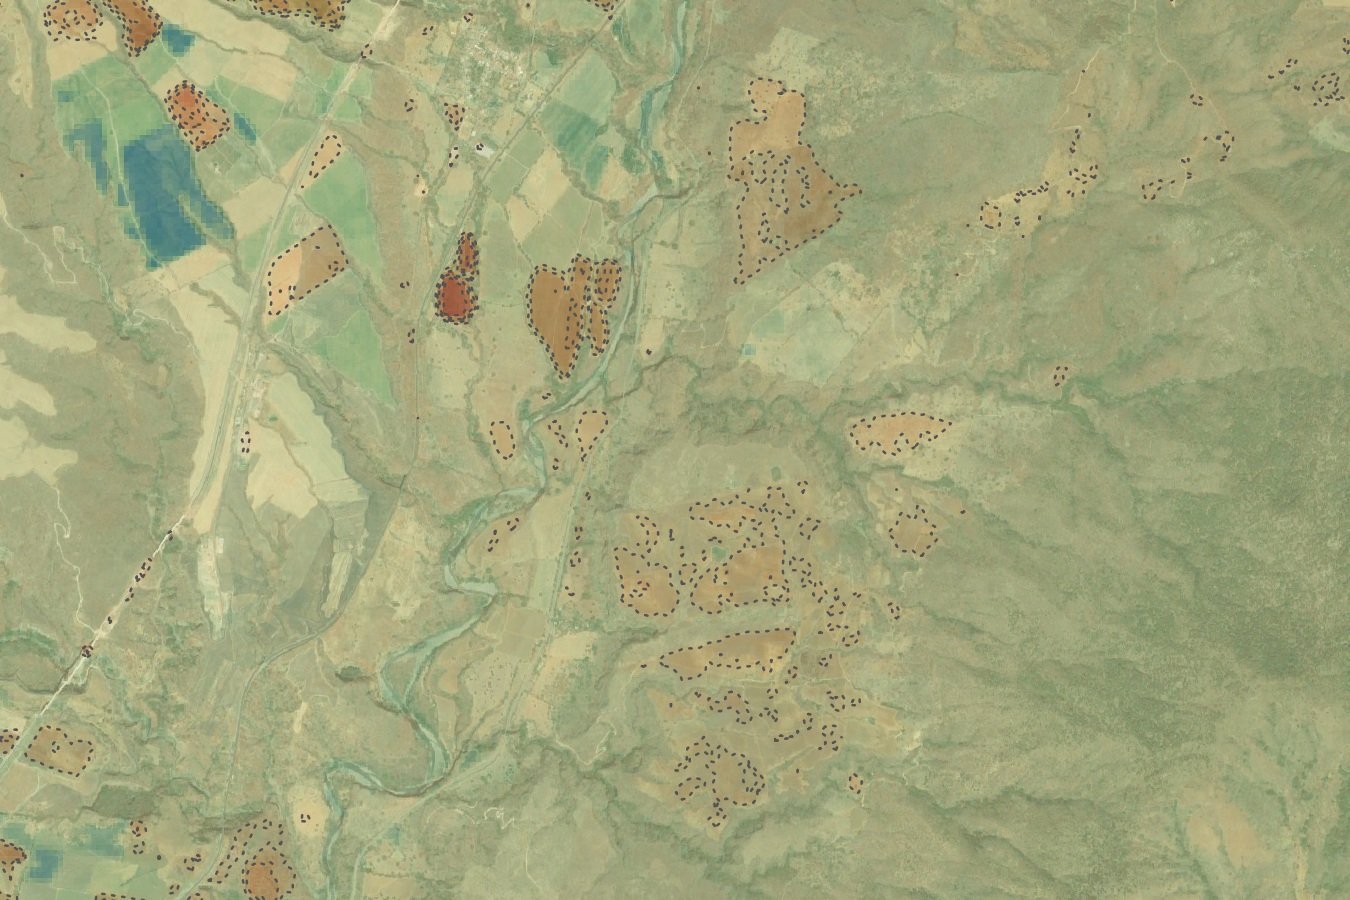
El análisis espacial y el aprendizaje automático a veces requieren una codificación masiva para lograr resultados decentes, como identificar plantas a partir de una ortofoto de drones. Queríamos crear un flujo de trabajo simple para que los usuarios principiantes e intermedios de Python trabajaran con estas bibliotecas sin mucho dolor o frustración. Este tutorial tiene el procedimiento completo para usar una clase de Python que reconoce plantas de una ortofoto basada en puntos de muestra, crea rasters intermedios e identifica plantas como shapefiles de puntos.
Tutorial
Código
from workingTools import cropRecognition
import matplotlib.pyplot as plt
Create crop object
crop = cropRecognition()Define raster and sample plants
crop.defineRaster('../odm_orthophoto/agaveCrop.tif')CRS of Raster Data: EPSG:4326
Number of Raster Bands: 3
Interpretation of Raster Bands: (<ColorInterp.red: 3>, <ColorInterp.green: 4>, <ColorInterp.blue: 5>)crop.definePoints('../Shp/agavePoints_3p.shp')CRS of Point Data: epsg:4326Retrieve information about the raster and plants
# get raster crs
crop.cropRaster.crsCRS.from_epsg(4326)# get point coordinates
crop.pointCoords[(-104.60251209450945, 21.488914700478507),
(-104.6026805707282, 21.488557889609346),
(-104.60290182768277, 21.488567022907)]Define parameter for the match template and raster band
# ratio of analysis
crop.pointRatio = 40
# raster band for the match template analysis
crop.selectedBand = crop.blueBand
# sample row, col and array for each point
crop.getPointRowCol()
Point N°:0 corresponds to row, col: 161, 6842
Point N°:1 corresponds to row, col: 3162, 5517
Point N°:2 corresponds to row, col: 3085, 3776# plant arrays
crop.plotReferenceImages()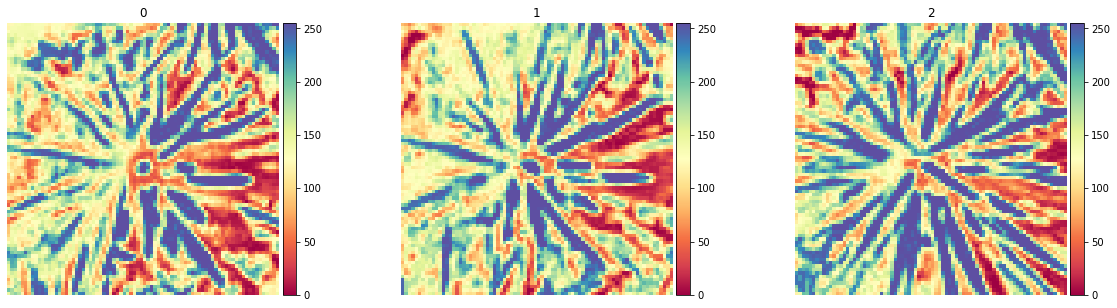
Perform single match template
# define object order and output raster path
matchTemplate2 = crop.singleMatchTemplate(2,'../Rst/matchTemplate2.tif')
# plot match template
#plt.imshow(matchTemplate0)Match template analysis for all points
# define method (quantile or threshold) and value
crop.pointsMatchTemplate('threshold',0.32)
Processing image Nº 0
Processing image Nº 1
Processing image Nº 2# plot all templates
#crop.plotAllTemplates()
# save match template to a shapefile
crop.saveMatchShp('../Shp/matchCrop.shp')Cluster analysis
# Birch clustering
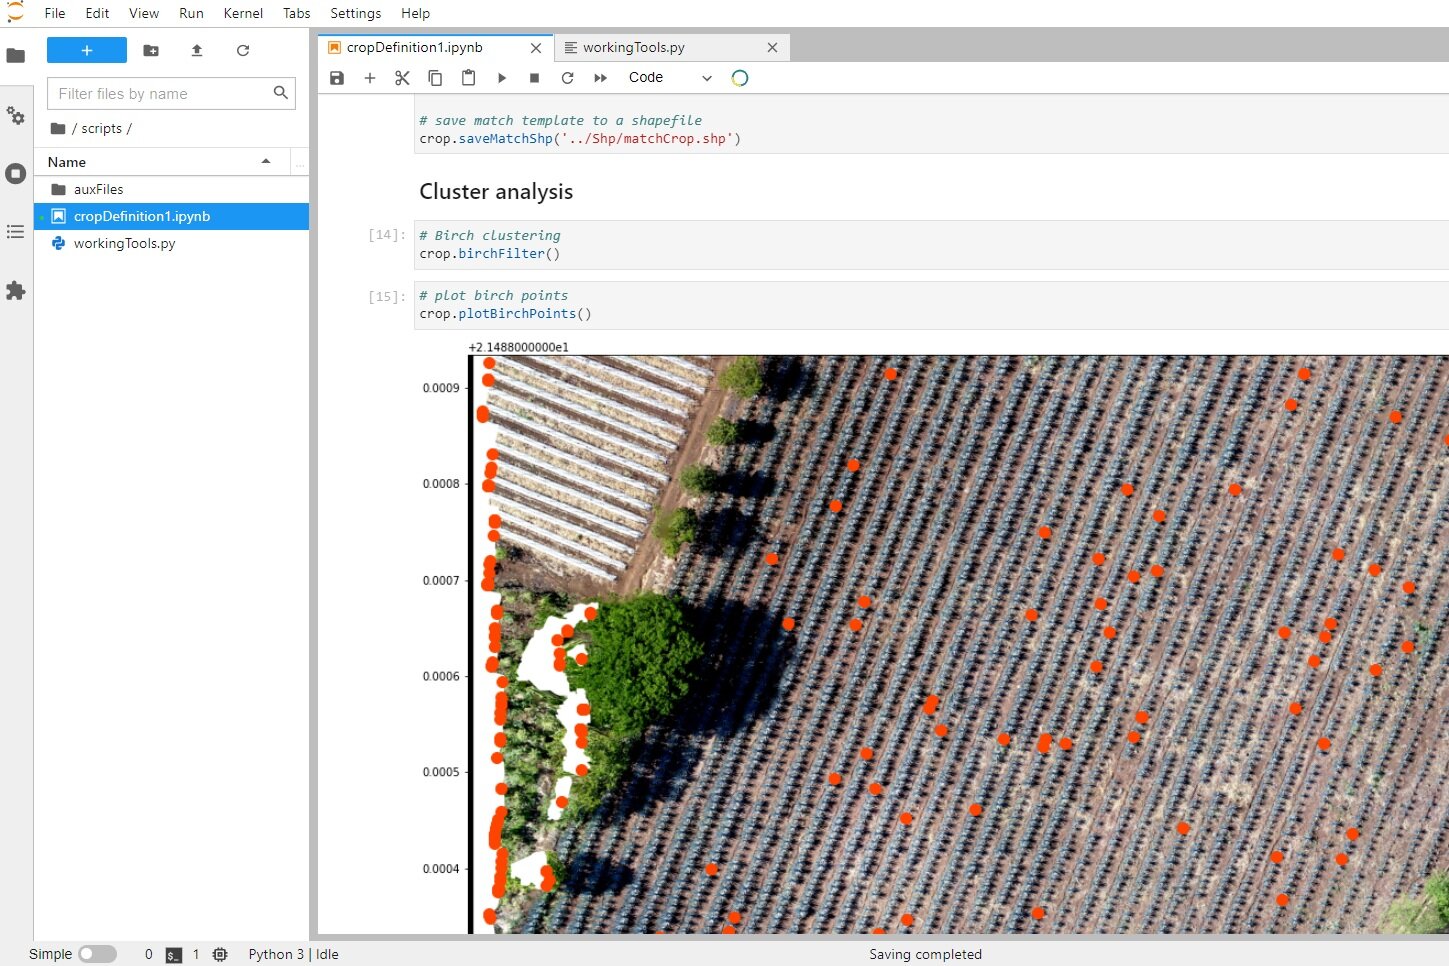
crop.birchFilter()# plot birch points
crop.plotBirchPoints()
Datos de entrada
Puede descargar el código desde este enlace.
Un repositorio con el código y las ortofotos está disponible en este enlace:
https://github.com/SaulMontoya/spatialPythonClassCropRecognitionDroneOrtophoto