Existen estándares para las descripciones litológicas, pero no hay estándares sobre cómo almacenar información litológica y relacionarla con la posición de perforación. Esta incompatibilidad conlleva al uso de muchos formatos y archivos de datos relacionados con software abierto y comercial.
En la búsqueda de "una herramienta que maneja todas las herramientas", como un concepto similar del "único anillo que las gobierna a todos los anillos" del Señor de los Anillos (JRR Tolkien), encontramos que Python y sus bibliotecas: Pandas, Pyvista y VTK puede hacer un trabajo decente en la compilación, geotransformación, ubicación espacial y generación de geometría 3D.
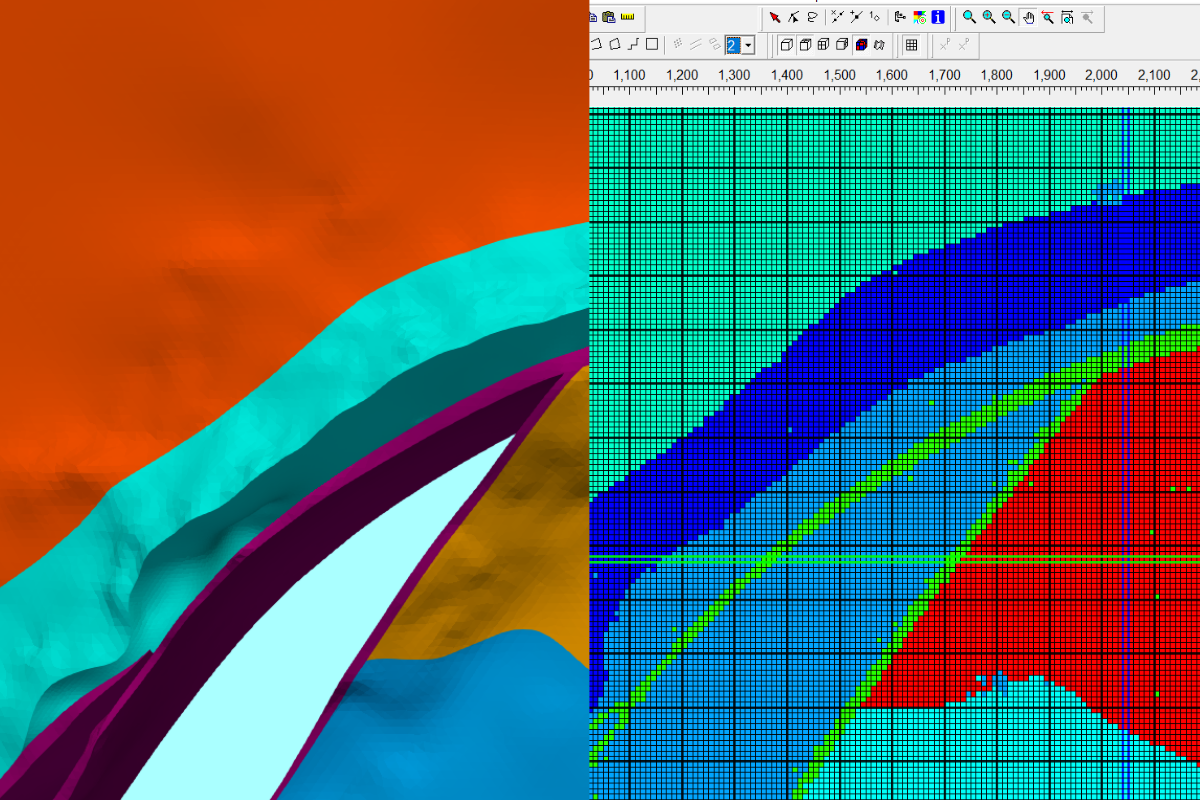
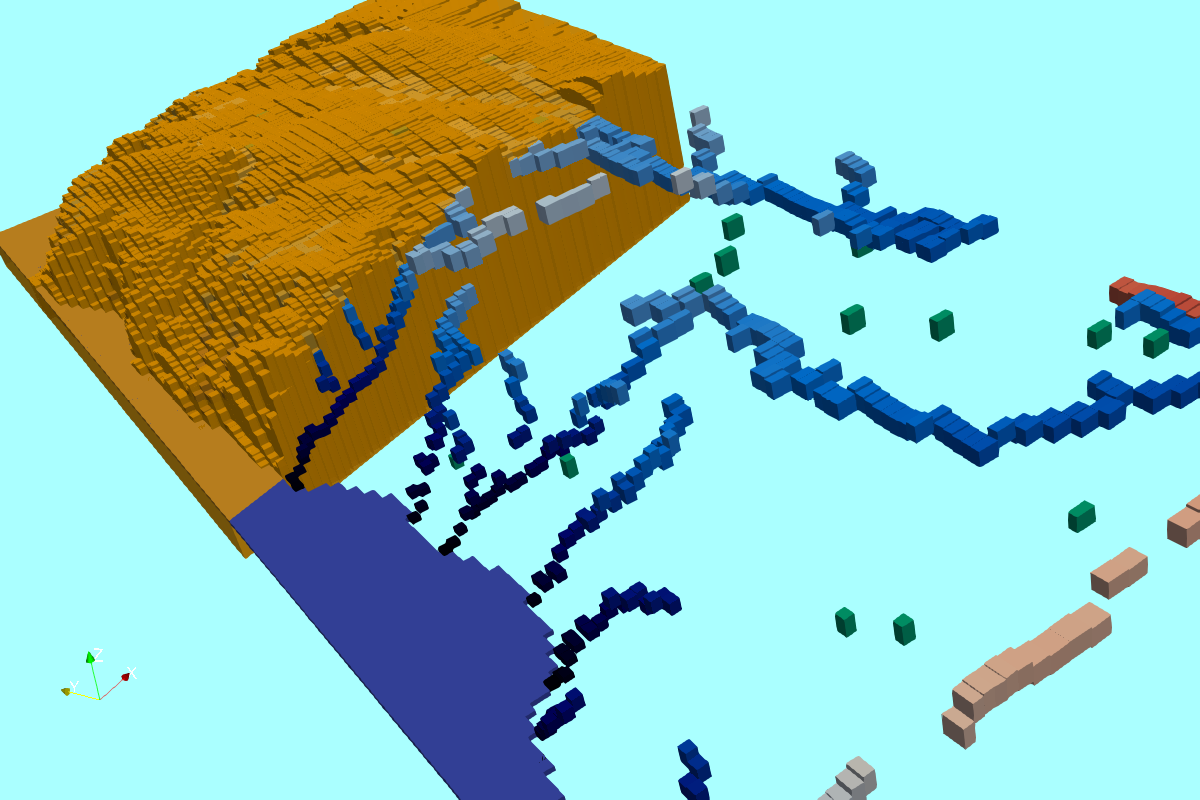
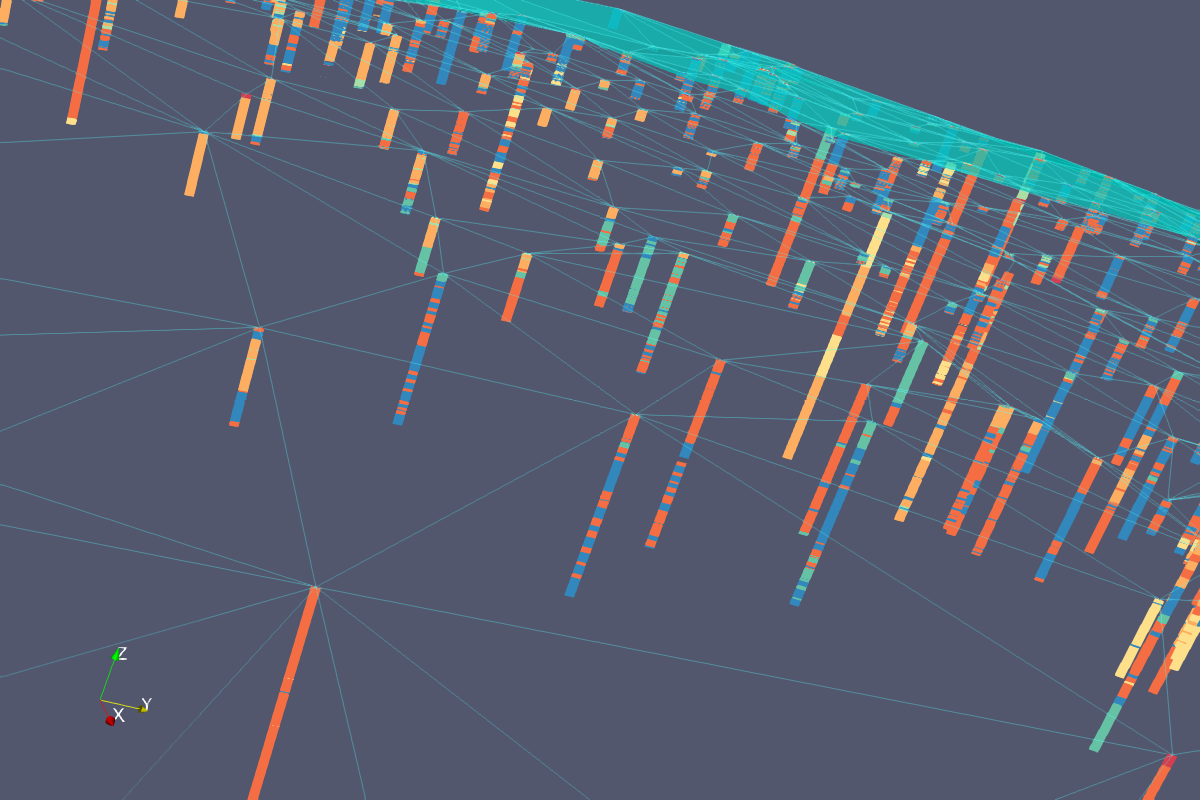
Este tutorial trata sobre la visualización en 3D como archivos Vtk en Paraview de la información litológica de cientos de pozos ubicados en el río Snake - Idaho. El tutorial cubre todos los pasos desde la descarga del procesamiento de información en bruto a la generación de listas y matrices para el archivo Vtk. El trabajo de secuencias de comandos se realizó en un Jupyter Nobebook y los archivos 3D de salida se representaron en Paraview.
Video
Código
Este es el código utilizado para el tutorial:
import pandas as pd
import pyvista as pv
import numpy as np
import vtk
#import well location
wellLoc = pd.read_csv('../inputData/TV-HFM_Wells_1Location.csv',header=1,index_col=0,
usecols=[0,2,3,6],skipfooter=1,engine='python')
wellLoc.head()| Easting | Northing | Altitude_ft | |
|---|---|---|---|
| Bore | |||
| A. Isaac | 2333140.95 | 1372225.65 | 3204.0 |
| A. Woodbridge | 2321747.00 | 1360096.95 | 2967.2 |
| A.D. Watkins | 2315440.16 | 1342141.86 | 3168.3 |
| A.L. Clark; 1 | 2276526.30 | 1364860.74 | 2279.1 |
| A.L. Clark; 2 | 2342620.87 | 1362980.46 | 3848.6 |
#change coordinate system and elevation
from pyproj import Transformer
transformer = Transformer.from_crs('esri:102605','epsg:32611',always_xy=True)
points = list(zip(wellLoc.Easting,wellLoc.Northing))
coordsWgsUTM = np.array(list(transformer.itransform(points)))
wellLoc['EastingUTM']=coordsWgsUTM[:,0]
wellLoc['NorthingUTM']=coordsWgsUTM[:,1]
wellLoc['Elevation_m']=wellLoc['Altitude_ft']*0.3048
wellLoc.head()| Easting | Northing | Altitude_ft | EastingUTM | NorthingUTM | Elevation_m | |
|---|---|---|---|---|---|---|
| Bore | ||||||
| A. Isaac | 2333140.95 | 1372225.65 | 3204.0 | 575546.628834 | 4.820355e+06 | 976.57920 |
| A. Woodbridge | 2321747.00 | 1360096.95 | 2967.2 | 564600.366582 | 4.807827e+06 | 904.40256 |
| A.D. Watkins | 2315440.16 | 1342141.86 | 3168.3 | 558944.843404 | 4.789664e+06 | 965.69784 |
| A.L. Clark; 1 | 2276526.30 | 1364860.74 | 2279.1 | 519259.006159 | 4.810959e+06 | 694.66968 |
| A.L. Clark; 2 | 2342620.87 | 1362980.46 | 3848.6 | 585351.150270 | 4.811460e+06 | 1173.05328 |
#generation of surface as delanuay tringulation
elevArray = wellLoc.loc[:,['EastingUTM','NorthingUTM','Elevation_m']].to_numpy()
elevCloud = pv.PolyData(elevArray)
surf = elevCloud.delaunay_2d()
surf.save('../outputData/elevSurf.vtk',binary=False)
#import well lithology
wellLito = pd.read_csv('../inputData/TV-HFM_Wells_2Lithology.csv',skipfooter=1,
header=1,index_col=0, usecols=[0,1,2,3],engine='python')
wellLito.head()| Depth_top_L | Depth_bot_L | PrimaryLith | |
|---|---|---|---|
| Bore | |||
| A. Isaac | 0.0 | 1.0 | Soil |
| A. Isaac | 1.0 | 53.0 | Sand |
| A. Isaac | 53.0 | 248.0 | Basalt |
| A. Isaac | 248.0 | 265.0 | Sand |
| A. Isaac | 265.0 | 323.0 | Basalt |
#create a dictionary for the lito code
litoDict = {}
i=0
for lito in wellLito.PrimaryLith.unique():
    litoDict[lito]=i
    i+=1
litoDict
{'Soil': 0,
'Sand': 1,
'Basalt': 2,
'Granite': 3,
'Hardpan/Caliche': 4,
'Cinders/Scoria': 5,
'Gravel': 6,
'Clay': 7,
'Talc/Soapstone': 8,
'Shale': 9,
'Lignite/Coal/Peat': 10,
'Sandstone': 11,
'Lime': 12,
'Claystone': 13,
'Mud': 14,
'Ash/Tuff': 15,
'Mudstone': 16,
'Rhyolite': 17,
'Siltstone': 18,
'Silt': 19,
'Shell': 20,
'Conglomerate': 21,
'Volcanics': 22,
'Chert': 23,
'Pyrite': 24,
'Limestone/marl': 25,
'Wood': 26,
'Andesite': 27}#identify lito by the code on the dataframe
wellLito['litoCode']=wellLito.PrimaryLith
wellLito = wellLito.replace({"litoCode": litoDict})
wellLito.head()| Depth_top_L | Depth_bot_L | PrimaryLith | litoCode | |
|---|---|---|---|---|
| Bore | ||||
| A. Isaac | 0.0 | 1.0 | Soil | 0 |
| A. Isaac | 1.0 | 53.0 | Sand | 1 |
| A. Isaac | 53.0 | 248.0 | Basalt | 2 |
| A. Isaac | 248.0 | 265.0 | Sand | 1 |
| A. Isaac | 265.0 | 323.0 | Basalt | 2 |
#generation of list arrays for the vtk
offsetList = []
linSec = []
linVerts = []

i=0
for index, values in wellLito.iterrows():
    x, y, z =wellLoc.loc[index][['EastingUTM','NorthingUTM','Elevation_m']]
    topLito = z - (values.Depth_top_L)*0.3048
    botLito = z- (values.Depth_bot_L)*0.3048
    cellVerts = [[x,y,topLito],[x,y,botLito]]
    offsetList.append(i*3)
    linSec = linSec + [2,2*i,2*i+1]
    linVerts = linVerts + cellVerts
    i +=1

offsetArray = np.array(offsetList)
linArray = np.array(linSec)
cellType = np.ones([i])*3
vertArray = np.array(linVerts)
# create the unstructured grid and assign lito code
grid = pv.UnstructuredGrid(offsetArray, linArray, cellType, vertArray)
grid.cell_arrays["values"] = wellLito.litoCode.values
grid.save('../outputData/wellLito.vtu',binary=False)1Datos de entrada
Puede descargar los datos de entrada desde este enlace.