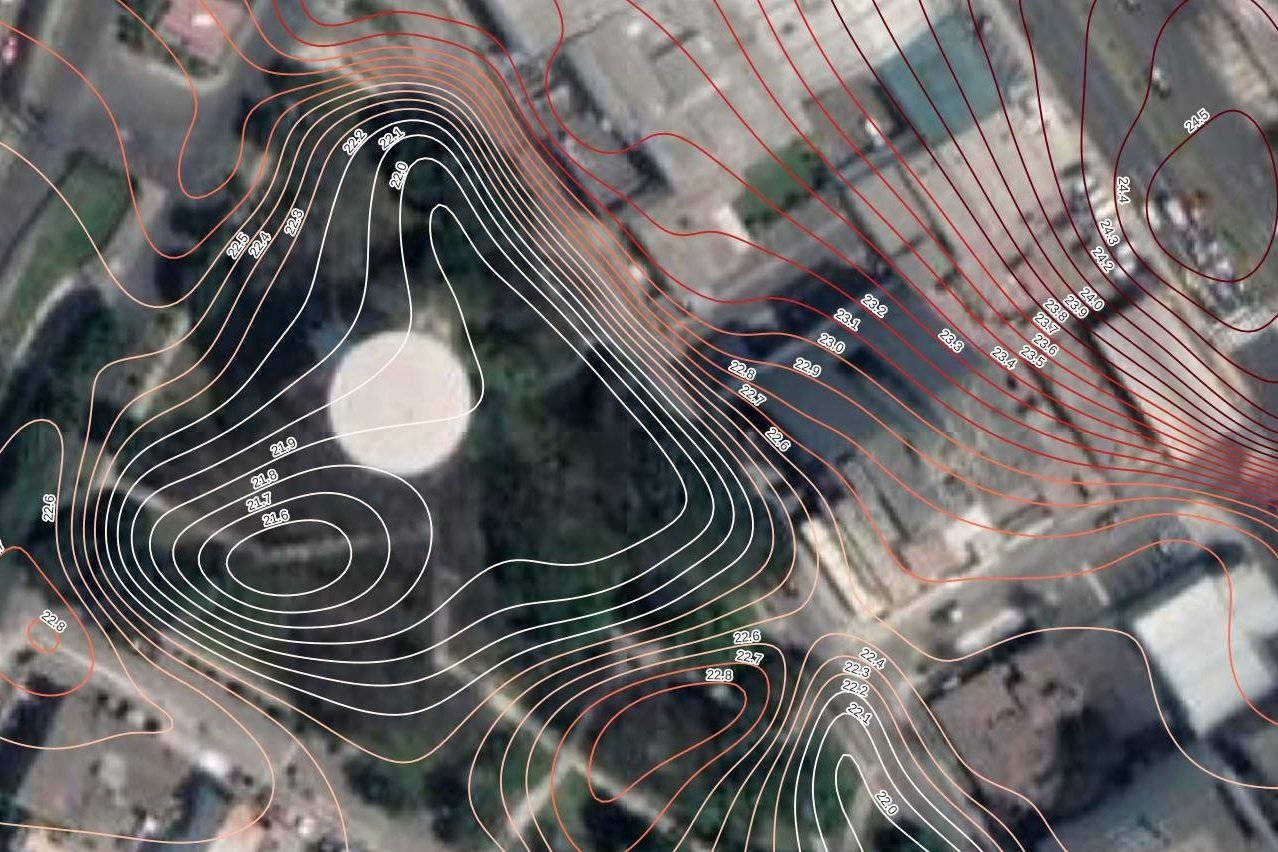
Descubriendo la analogía de los procedimientos en software GIS de escritorio a Python, asumimos que el proceso de extracción de contornos de ráster estaba bien documentado o habían muchos tutoriales sobre el tema. Descubrimos que no habían muchas opciones para realizar este proceso con éxito o con poco dolor. Es por esto que hemos realizado un tutorial completo sobre el proceso de creación de contornos a partir de un ráster de elevación con Python y GDAL que incluye datos de entrada, scripts y una discusión sobre los pasos principales del procesamiento.
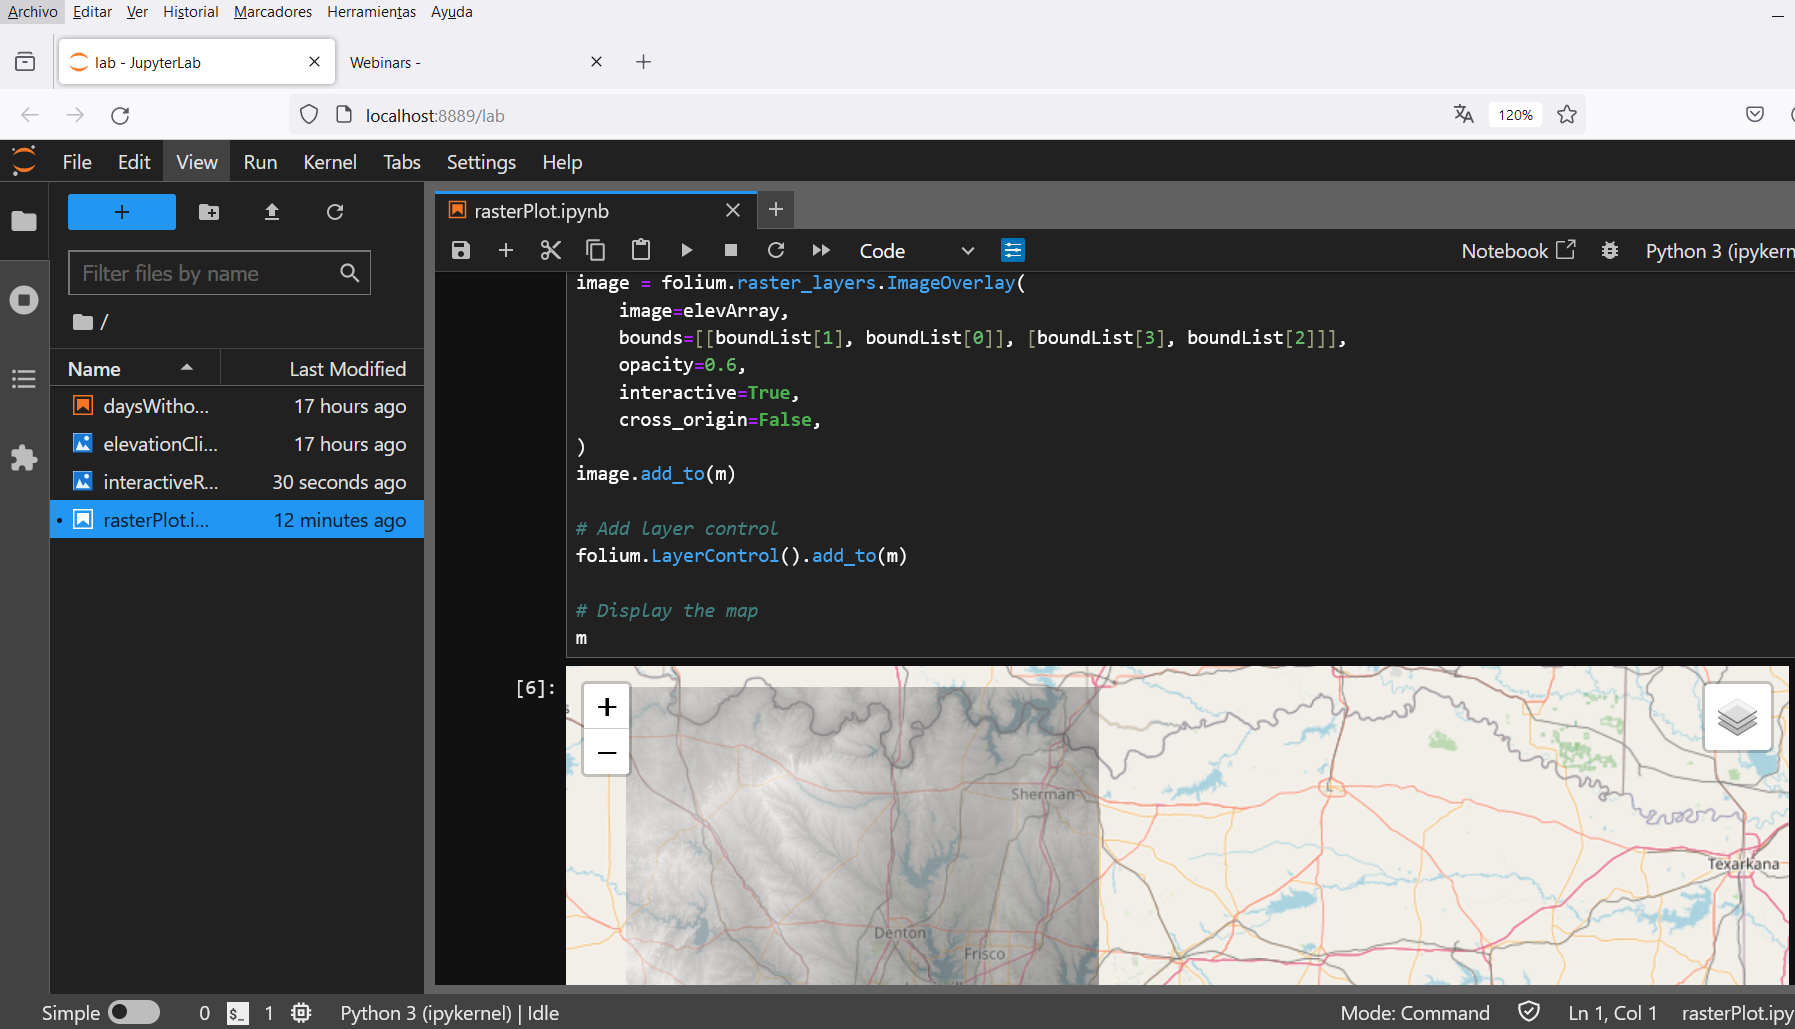
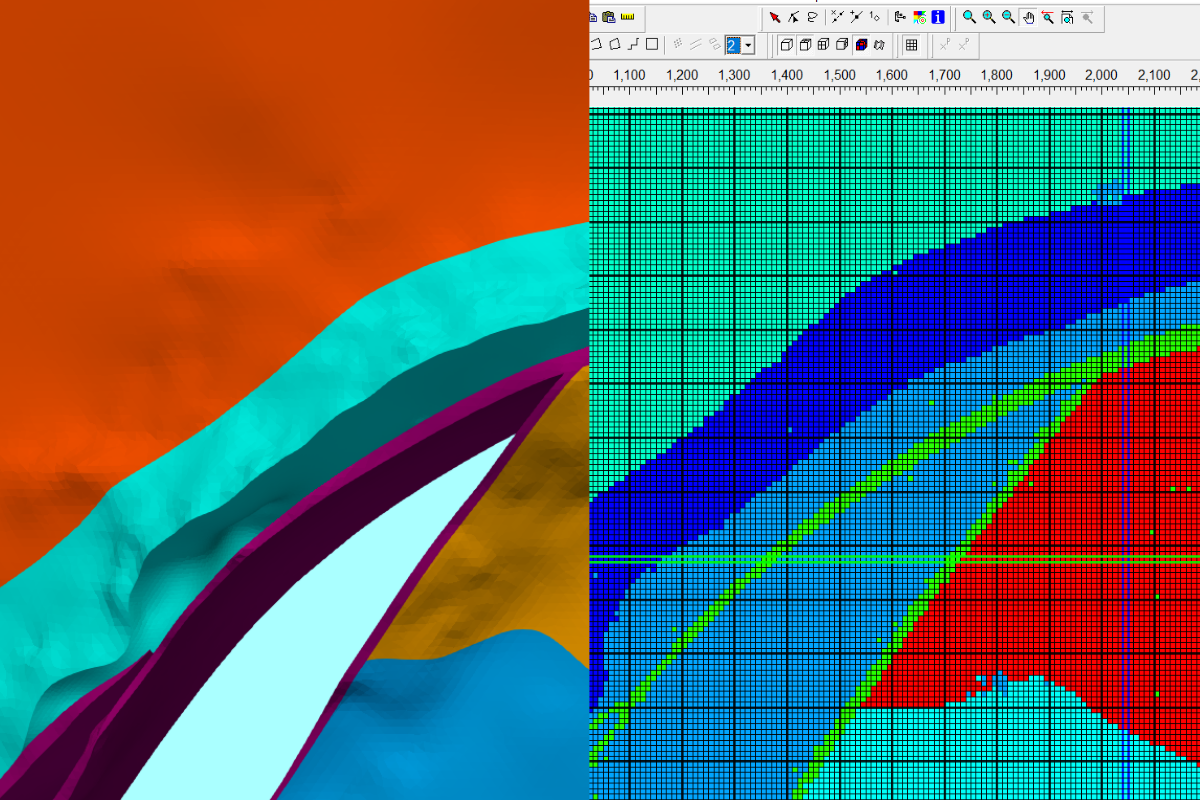
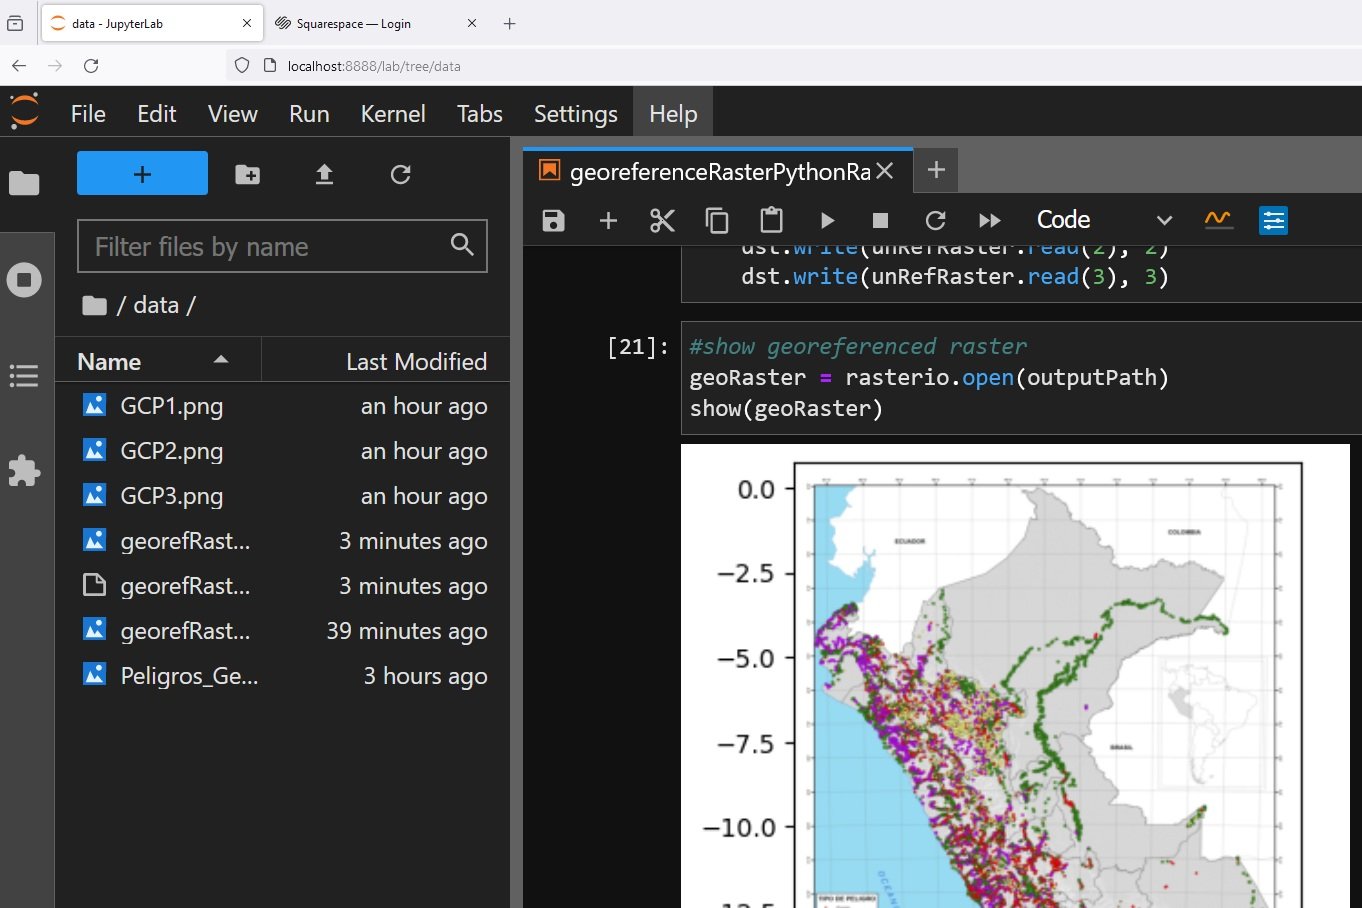
Hay dos formas de representar los shapefiles de contorno resultantes, la primera está en QGIS y la segunda está dentro de Jupyter con Ipyleaflet.
Tiene tres formas de ejecutar este código:
Usando Anaconda con GDAL instalado
Desde el servidor de Hakuchik: hakuchik.hatarilabs.com (necesita una cuenta de Github)
De la imagen de Hakuchik para Docker: docker run -it -p 8888:8888 hatarilabs/hakuchik:74a2c9c18727
Tutorial
Datos de entrada
Descarga los datos de entrada desde este enlace. O simplemente puede clonar el repositorio con:
git clone https://github.com/SaulMontoya/rasterToContourwithPythonandGDAL.git
Código
Este es el código Python completo que se usó para el tutorial:
import numpy as np
from osgeo import osr
from osgeo import ogr
from osgeo import gdal
#Open tif file as select band
rasterDs = gdal.Open('../rst/20190109125130_1063922483_WGS13N.tif')
rasterBand = rasterDs.GetRasterBand(1)
proj = osr.SpatialReference(wkt=rasterDs.GetProjection())
#Get elevation as numpy array
elevArray = rasterBand.ReadAsArray()
print(elevArray[:4,:4])
#define not a number
demNan = -32768
#get dem max and min
demMax = elevArray.max()
demMin = elevArray[elevArray!=demNan].min()
print("Maximun dem elevation: %.2f, minimum dem elevation: %.2f"%(demMax,demMin))[[-32768 -32768 -32768 -32768]
[-32768 -32768 -32768 -32768]
[-32768 -32768 -32768 -32768]
[-32768 -32768 -32768 -32768]]
Maximun dem elevation: 2728.00, minimum dem elevation: 1247.00contourPath = '../shp/contoursIncremental.shp'
contourDs = ogr.GetDriverByName("ESRI Shapefile").CreateDataSource(contourPath)
#define layer name and spatial
contourShp = contourDs.CreateLayer('contour', proj)
#define fields of id and elev
fieldDef = ogr.FieldDefn("ID", ogr.OFTInteger)
contourShp.CreateField(fieldDef)
fieldDef = ogr.FieldDefn("elev", ogr.OFTReal)
contourShp.CreateField(fieldDef)
#Write shapefile using noDataValue
#ContourGenerate(Band srcBand, double contourInterval, double contourBase, int fixedLevelCount, int useNoData, double noDataValue,
# Layer dstLayer, int idField, int elevField
gdal.ContourGenerate(rasterBand, 50.0, 1250.0, [], 1, -32768.,
contourShp, 0, 1)
contourDs.Destroy()contourPath = '../shp/contoursDefined.shp'
contourDs = ogr.GetDriverByName("ESRI Shapefile").CreateDataSource(contourPath)
#define layer name and spatial
contourShp = contourDs.CreateLayer('contour', proj)
#define fields of id and elev
fieldDef = ogr.FieldDefn("ID", ogr.OFTInteger)
contourShp.CreateField(fieldDef)
fieldDef = ogr.FieldDefn("elev", ogr.OFTReal)
contourShp.CreateField(fieldDef)
#define number of contours and range
conNum = 50
conList =[int(x) for x in np.linspace(demMin,demMax,conNum)]
#Write shapefile using noDataValue
#ContourGenerate(Band srcBand, double contourInterval, double contourBase, int fixedLevelCount, int useNoData, double noDataValue,
# Layer dstLayer, int idField, int elevField
gdal.ContourGenerate(rasterBand, 0, 0, conList, 1, -32768.,
contourShp, 0, 1)
contourDs.Destroy()from ipyleaflet import Map, GeoData, LayersControl
import geopandas as gpd
m = Map(center=(27.8840, -107.8895), zoom=10)
contourDf = gpd.read_file('../shp/contoursDefined.shp')
contourDfWgs84 = contourDf.to_crs(epsg=4326)
geo_data = GeoData(geo_dataframe = contourDfWgs84 )
m.add_layer(geo_data)
m.add_control(LayersControl())
mMap(center=[27.884, -107.8895], controls=(ZoomControl(options=['position', 'zoom_in_text', 'zoom_in_title', 'z…