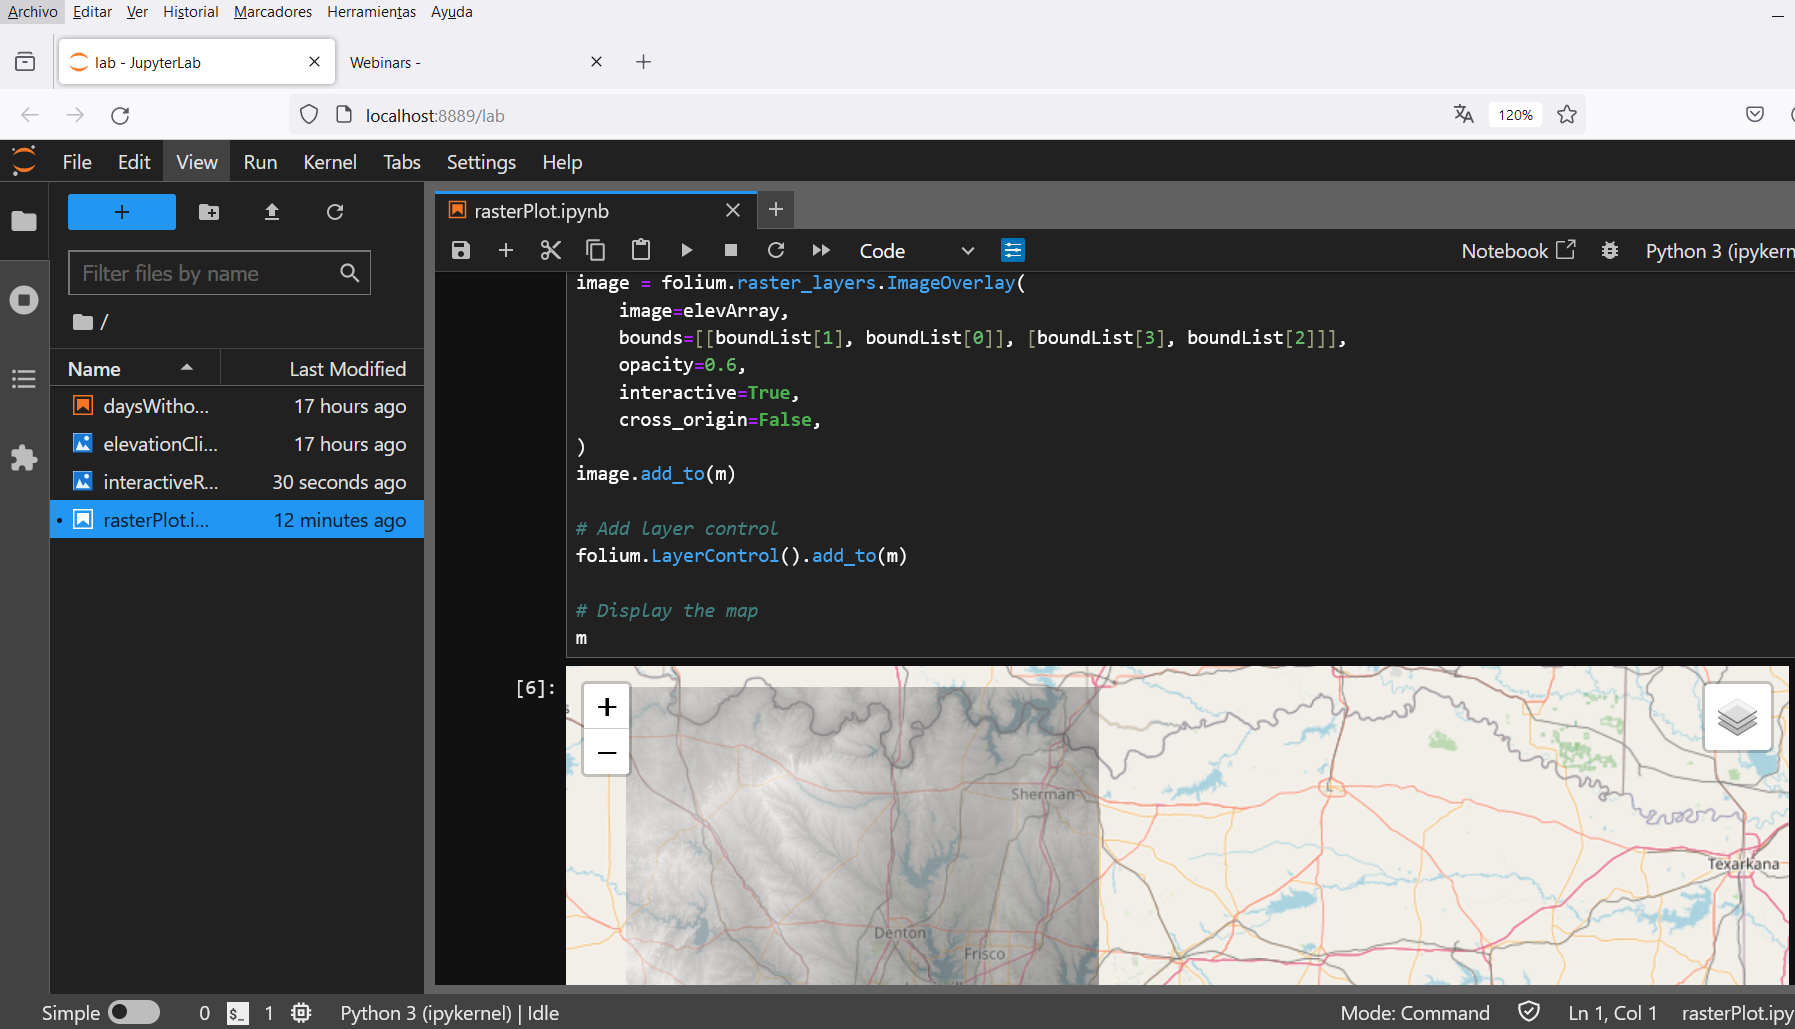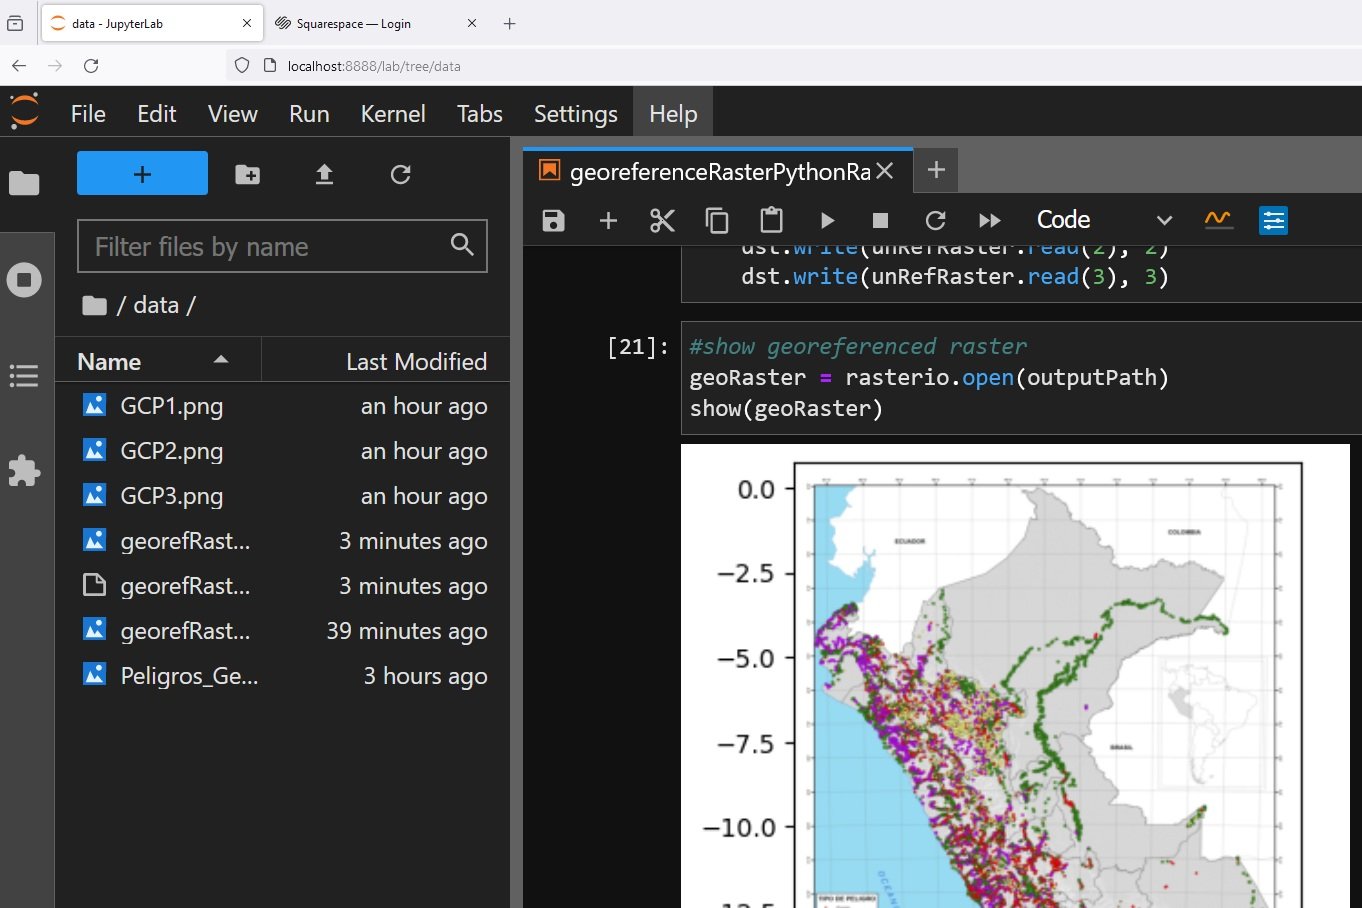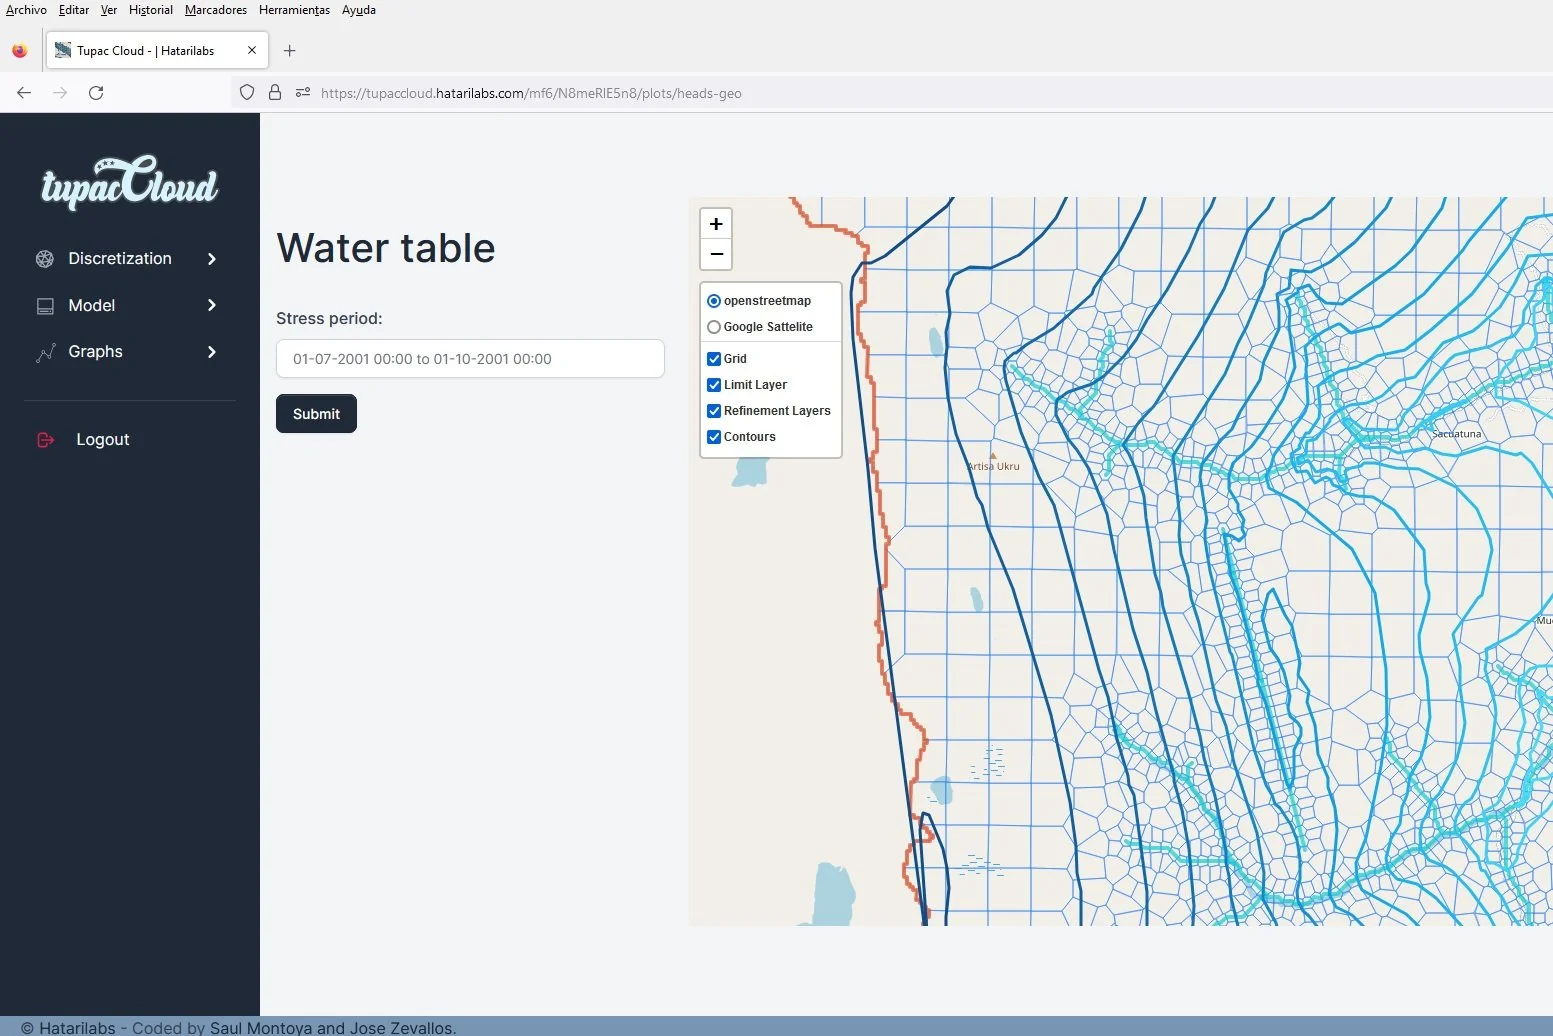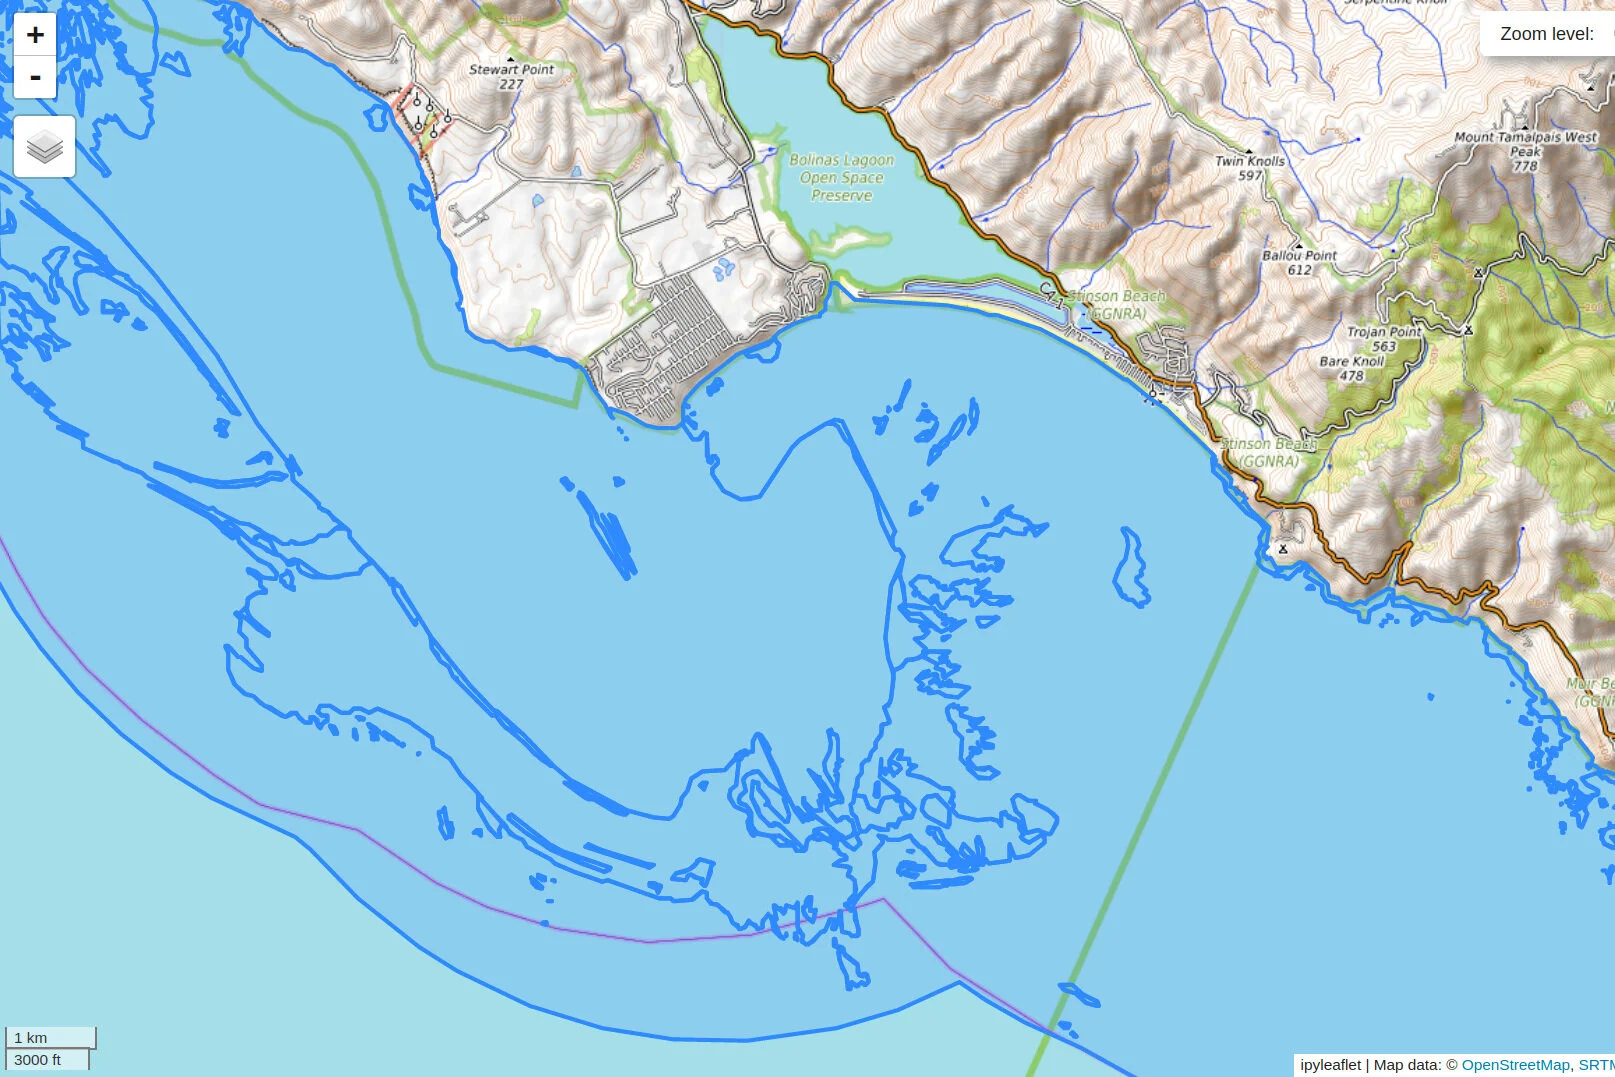
Ya sea que desee explorar o visualizar un Shapefile sin salir del entorno de Jupyterlab o simplemente desee una mejor herramienta para la representación espacial, este tutorial puede ser de su interés. Hemos desarrollado una aplicación interactiva en Jupyterlab con Ipyleaflet y Voila que representan un shapefile seleccionado en un lienzo con opciones para mapas base, zoom y otros.
Tiene tres formas de ejecutar este código:
Desde el servidor de Hakuchik: hakuchik.hatarilabs.com (se requiere una cuenta de Github)
De la imagen de Hakuchik para Docker: docker run -it -p 8888: 8888 hatarilabs / hakuchik: 74a2c9c18727
Usando Anaconda con todas las bibliotecas instaladas - No recomendado
Los scripts y archivos para este tutorial se almacenan en este repositorio:
https://github.com/SaulMontoya/interactiveShapefileExplorationonJupyterlab
Animación
Tutorial
Código
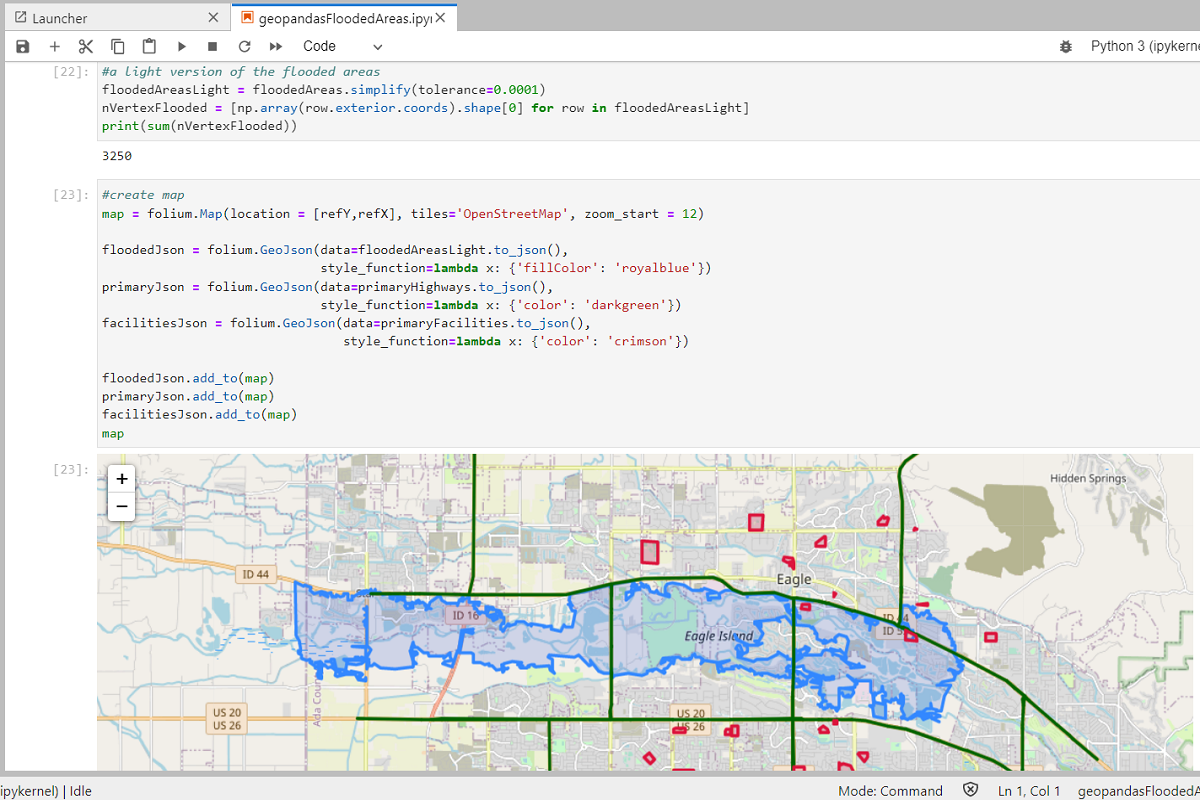
Este es el código en Python utilizado para la visualización:
#import required packages
import os, json
import geopandas as gpd
from ipywidgets import widgets
from ipyleaflet import Map, GeoData, basemaps, LayersControl, ScaleControl, FullScreenControl, WidgetControl
from ipywidgets import widgets, IntSlider, jslink
#get shapefile name list
shpList = [x[:-4] for x in os.listdir('../shp') if x[-3:]=='shp']
#dropdown widget
selDrop = widgets.Dropdown(
options=shpList,
value=shpList[0],
description='Shapefile:',
disabled=False,
)
display(selDrop)
#button widget
selBot = widgets.Button(
description='Select shapefile',
disabled=False,
button_style='success', # 'success', 'info', 'warning', 'danger' or ''
tooltip='Select shapefile',
icon='check'
)
display(selBot)
#map object
m = Map(center=(52.3,8.0), zoom = 10,
basemap = basemaps.OpenTopoMap)
zoom_slider = IntSlider(description='Zoom level:', min=0, max=15, value=10)
jslink((zoom_slider, 'value'), (m, 'zoom'))
widgetControl = WidgetControl(widget=zoom_slider, position='topright')
m.add_control(widgetControl)
m.add_layer(basemaps.OpenStreetMap.Mapnik)
m.add_control(ScaleControl(position='bottomleft'))
m.add_control(FullScreenControl(position='topright'))
m.add_control(LayersControl())
display(m)
#show map function
def showMap(selShp):
selDf = gpd.read_file('../shp/'+selShp+'.shp')
geoDf = selDf.to_crs(4326)
lonCent = (geoDf.bounds.maxx + geoDf.bounds.minx).mean()/2
latCent = (geoDf.bounds.maxy + geoDf.bounds.miny).mean()/2
m.center = (latCent,lonCent)
geoData = GeoData(geo_dataframe=geoDf, name=selShp)
m.add_layer(geoData)
#on click function
def on_button_clicked(b):
showMap(selDrop.value)
selBot.on_click(on_button_clicked)