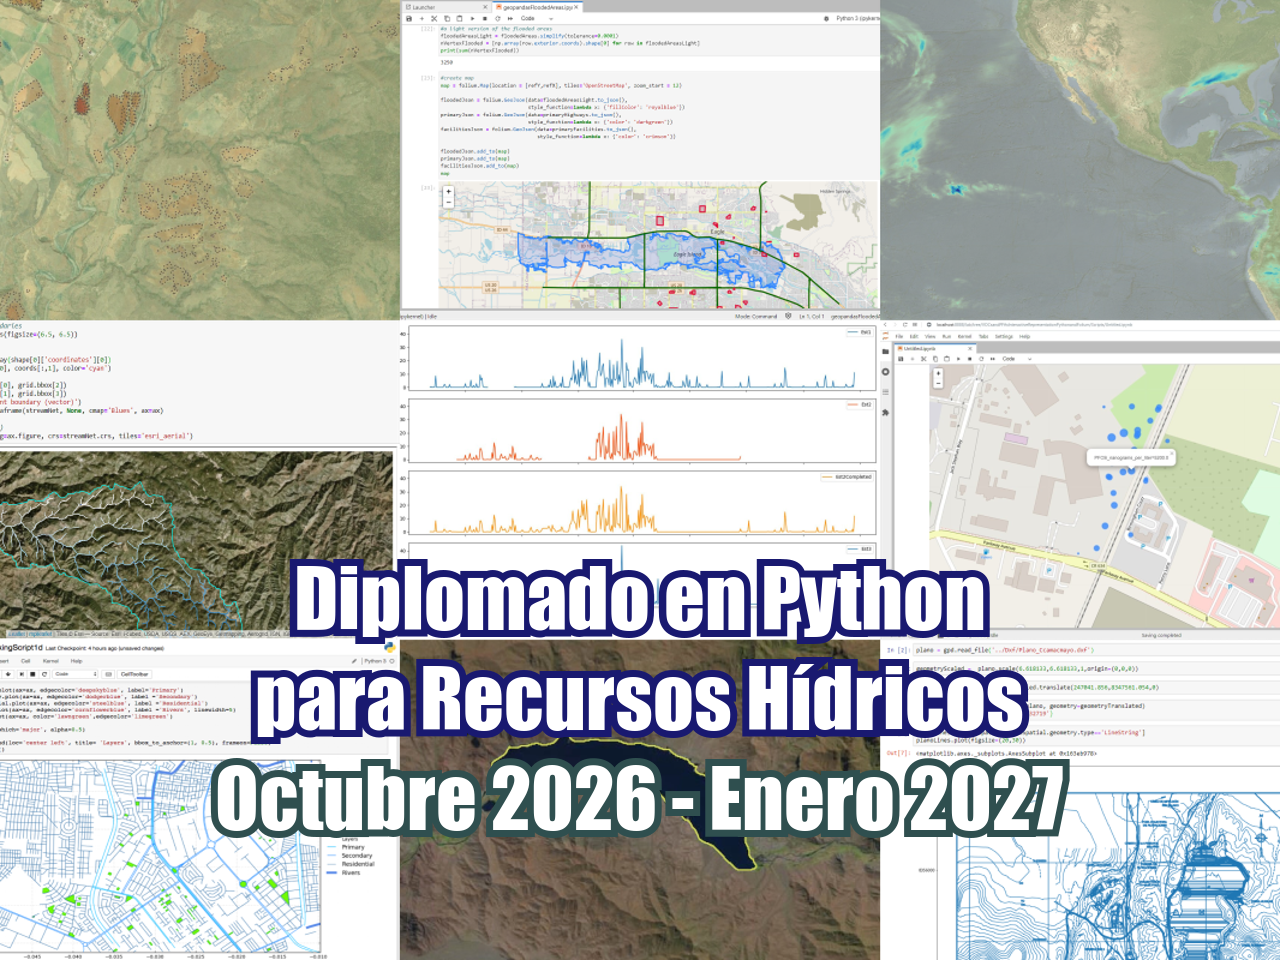
La imágenes satelitales nos han dado la capacidad de observar la superficie terrestre en los últimos años, pero no hemos tenido tanto éxito en comprender las dinámicas de la cobertura del suelo y su interacción con factores económicos, sociológicos y políticos. Se han encontrado algunas deficiencias para este tipo de análisis al usar software comercial de SIG, pero también existen limitaciones en la manera en que aplicamos procesos lógicos y matemáticos a un conjunto de imágenes satelitales. Trabajar con datos geoespaciales en Python nos da la capacidad de filtrar, calcular, recortar, iterar y exportar conjuntos de datos ráster o vectoriales haciendo un uso eficiente del poder computacional, lo que permite un mayor alcance en el análisis de datos.
Este es un análisis aplicado de la dinámica de la cobertura del suelo en algunas regiones de Turquía para la evaluación de la aridificación del suelo y el abandono de tierras debido al cambio climático en la última década. El caso cubre todos los pasos en Python con las bibliotecas geoespaciales relacionadas para procesar imágenes de Sentinel 2 en un área de estudio, considerando condiciones hidrológicas y la reducción de valores atípicos.
Tutorial
Datos de ingreso
https://owncloud.hatarilabs.com/s/N2rZop3wc60TEGL
Password to descargar los datos: Hatarilabs.
Código
Part 1
import os
import rasterio
from rasterio import plot
from rasterio.crs import CRS
import matplotlib.pyplot as plt
import numpy as np
from rasterio.mask import mask
from rasterio.warp import calculate_default_transform, reproject, Resampling
import geopandas as gpd
from affine import Affine
aoiPath = '../shp/dagecitAreaBoundWgs37N.shp'
ndviDateList = [x for x in os.listdir('../rst') if '-' in x]
ndviDateListdef createTotalNdvi(ndviDate):
totalPath = os.path.join('../rst',ndviDate)
band4List = [x for x in os.listdir(totalPath) if x.endswith('B04.tif')]
band5List = [x for x in os.listdir(totalPath) if x.endswith('B05.tif')]
band4 = rasterio.open(os.path.join(totalPath,band4List[0]))
band5 = rasterio.open(os.path.join(totalPath,band5List[0]))
#generate nir and red objects as arrays in float64 format
red = band4.read(1).astype('float64')
nir = band5.read(1).astype('float64')
#ndvi calculation, empty cells or nodata cells are reported as 0
ndvi=np.where(
(nir+red)==0.,
0,
(nir-red)/(nir+red))
#export ndvi image
ndviImage = rasterio.open('../rst/ndviTotal/%s.tif'%ndviDate,'w',driver='Gtiff',
width=band4.width,
height = band4.height,
count=1, crs=band4.crs,
transform=band4.transform,
dtype='float32')
ndviImage.write(ndvi,1)
ndviImage.close()for ndviDate in ndviDateList:
createTotalNdvi(ndviDate)def reprojectRaster(ndvi):
inNdvi = os.path.join('../rst','ndviTotal',ndvi+'.tif')
outNdvi = os.path.join('../rst','ndviReproj',ndvi+'.tif')
with rasterio.open(inNdvi) as src:
dst_crs = "EPSG:32637"
transform, width, height = calculate_default_transform(
src.crs, dst_crs, src.width, src.height, *src.bounds)
kwargs = src.meta.copy()
kwargs.update({
"crs": dst_crs,
"transform": transform,
"width": width,
"height": height
})
with rasterio.open(outNdvi, "w", **kwargs) as dst:
for i in range(1, src.count + 1):
reproject(
source=rasterio.band(src, i),
destination=rasterio.band(dst, i),
src_transform=src.transform,
src_crs=src.crs,
dst_transform=transform,
dst_crs=dst_crs,
resampling=Resampling.nearest # or bilinear, cubic, etc.
)for ndviDate in ndviDateList:
reprojectRaster(ndviDate)outRes = 30
boundDf = gpd.read_file(aoiPath)
xDim = boundDf.total_bounds[2] - boundDf.total_bounds[0]
yDim = boundDf.total_bounds[3] - boundDf.total_bounds[1]
print(xDim,yDim)
ncol = int(xDim // outRes)
nrow = int(yDim // outRes)
print(ncol,nrow)print(boundDf.total_bounds)def clipRasterByMask(ndvi,boundDf):
inNdvi = os.path.join('../rst','ndviReproj',ndvi+'.tif')
outNdvi = os.path.join('../rst','ndviClip',ndvi+'.tif')
# Open the raster and apply the mask
with rasterio.open(inNdvi) as src:
out_image, out_transform = mask(src, boundDf.geometry.values, crop=True)
out_meta = src.meta.copy()
out_meta.update({
"driver": "GTiff",
"height": out_image.shape[1],
"width": out_image.shape[2],
"transform": out_transform
})
# Write the clipped raster
with rasterio.open(outNdvi, "w", **out_meta) as dest:
dest.write(out_image)for ndviDate in ndviDateList:
clipRasterByMask(ndviDate, boundDf)def resampleRasterByParams(ndvi,boundDf, ncol,nrow,outRes):
inNdvi = os.path.join('../rst','ndviClip',ndvi+'.tif')
outNdvi = os.path.join('../rst','ndviClipResampled',ndvi+'.tif')
with rasterio.open(inNdvi) as src:
transform = Affine(
outRes, 0, boundDf.total_bounds[0],
0, -outRes, boundDf.total_bounds[3]
)
kwargs = src.meta.copy()
kwargs.update({
'height': nrow,
'width': ncol,
'transform': transform
})
with rasterio.open(outNdvi, 'w', **kwargs) as dst:
reproject(
source=rasterio.band(src, 1),
destination=rasterio.band(dst, 1),
src_transform=src.transform,
src_crs=src.crs,
dst_transform=transform,
dst_crs=src.crs,
resampling=Resampling.bilinear
)for ndviDate in ndviDateList:
resampleRasterByParams(ndviDate,boundDf,ncol,nrow,outRes)Part 2
import os
import rasterio
from rasterio import plot
from rasterio.crs import CRS
import matplotlib.pyplot as plt
import numpy as np
from rasterio.mask import mask
from rasterio.warp import calculate_default_transform, reproject, Resampling
import fiona
ndviDateList = [x for x in os.listdir('../rst/ndviReproj') if x.endswith('.tif')]
ndviDateListdef calculateMeanNdvi(raster1, raster2, rasterName):
raster1Path = os.path.join('../rst/ndviClipResampled',raster1)
raster2Path = os.path.join('../rst/ndviClipResampled',raster2)
rst1 = rasterio.open(raster1Path)
rst2 = rasterio.open(raster2Path)
rst1Band = rst1.read(1).astype('float64')
rst2Band = rst2.read(1).astype('float64')
meanNdvi=np.where(
(rst1Band+rst2Band)==0.,
0,
(rst1Band+rst2Band)/2)
ndviImage = rasterio.open('../rst/ndviMean/%s.tif'%rasterName,'w',driver='Gtiff',
width=rst1.width,
height=rst1.height,
count=1, crs=rst1.crs,
transform=rst1.transform,
dtype='float32')
ndviImage.write(meanNdvi,1)
ndviImage.close()calculateMeanNdvi(ndviDateList[0], ndviDateList[1], 'ndvi_2013_2014')calculateMeanNdvi(ndviDateList[2], ndviDateList[3], 'ndvi_2023_2024')def calculateNdviDifference(raster1,raster2,rasterName,threshold):
raster1Path = os.path.join('../rst/ndviMean',raster1)
raster2Path = os.path.join('../rst/ndviMean',raster2)
rst1 = rasterio.open(raster1Path)
rst2 = rasterio.open(raster2Path)
rst1Band = rst1.read(1).astype('float64')
rst2Band = rst2.read(1).astype('float64')
diffNdvi=np.where(
(rst1Band-rst2Band)>=threshold,
rst1Band-rst2Band,
-9999)
ndviImage = rasterio.open('../rst/ndviMean/%s.tif'%rasterName,'w',driver='Gtiff',
width=rst1.width,
height=rst1.height,
count=1, crs=rst1.crs,
transform=rst1.transform,
dtype='float32',
nodata=-9999)
ndviImage.write(diffNdvi,1)
ndviImage.close()calculateNdviDifference('ndvi_2013_2014.tif','ndvi_2023_2024.tif','dif_2013_2023',0.03)