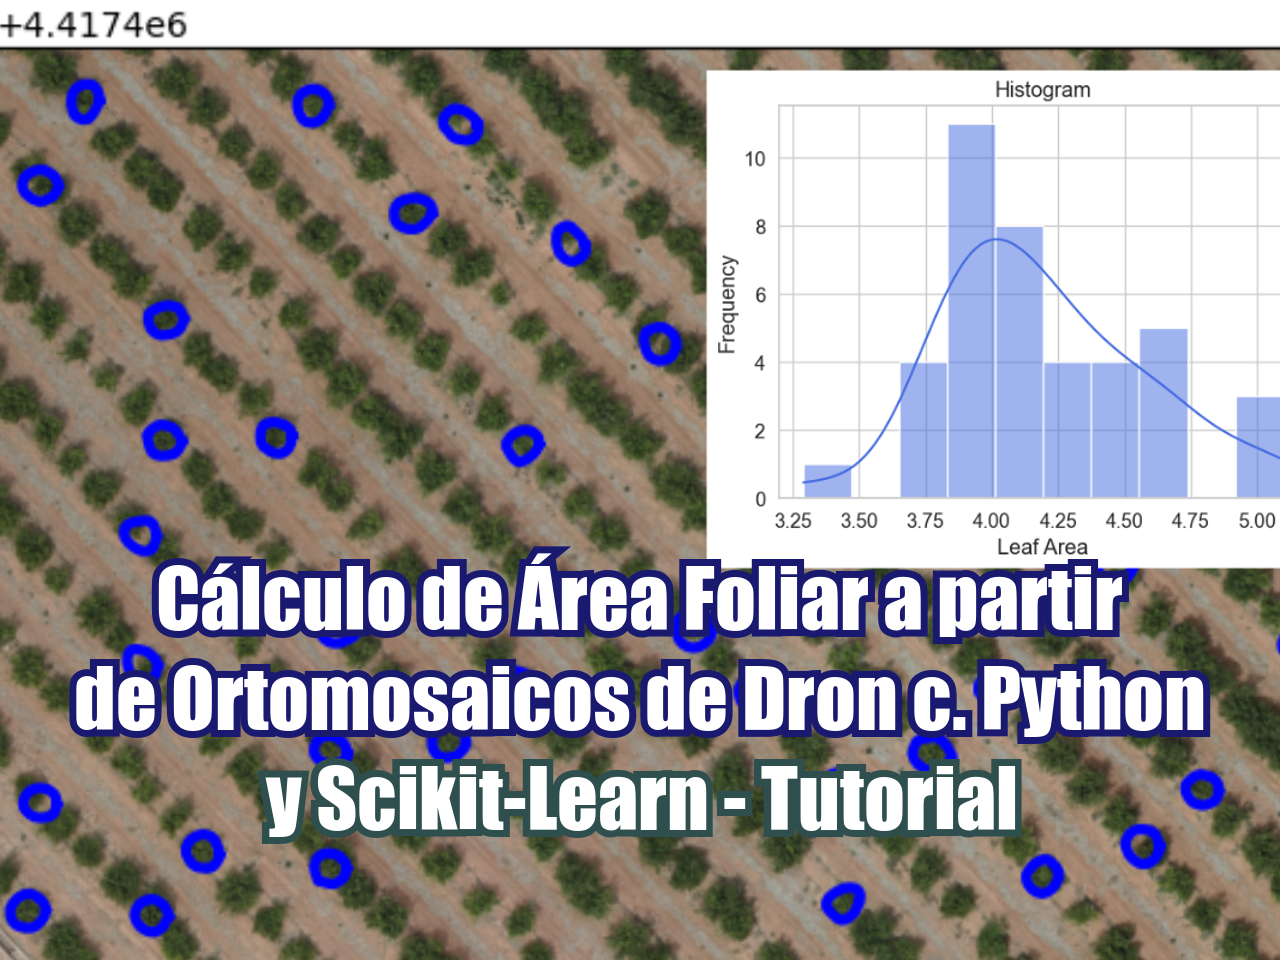
El análisis espacial y el aprendizaje automático a veces requieren una gran cantidad de programación para lograr resultados decentes, como identificar plantas a partir de una ortofoto tomada con dron. Queríamos crear un flujo de trabajo sencillo para usuarios principiantes e intermedios de Python, que les permitiera trabajar con estas bibliotecas sin demasiadas complicaciones ni frustraciones. Este tutorial contiene el procedimiento completo para usar un nuevo paquete de Python llamado hatariTools, que reconoce plantas a partir de una ortofoto basándose en puntos de muestra, genera gráficos intermedios e identifica las plantas como archivos shapefile de puntos.
Para mejorar la precisión de la detección de cultivos debes:
Tomar la ortofoto con la mínima cantidad de sombras, es decir, al mediodía.
Seleccionar plantas regulares y dejar suficiente espacio libre alrededor para definir bien su forma completa.
Evitar plantas que se crucen entre sí.
Puedes instalar la última versión de hatariTools con:
pip install -U hatariTools
Tutorial
Código
from hatariTools.geospatialIA.cropRecognition import cropCounting ## Org
import matplotlib.pyplot as plt ## Org
# Create crop object
crop = cropCounting() ## Org
build faster, analyze more
Follow us: |
 |
 |
 |
 |
 |
 |
/-------------------------------------------/

The crop recognition engine has been started

/-------------------------------------------/
# Define raster and sample plants
crop.defineRaster('../odm_orthophoto/agaveCropCoarseClip.tif') ## Org/-------------------------------------------/
CRS of Raster Data: EPSG:4326
Number of Raster Bands: 3
Interpretation of Raster Bands: (<ColorInterp.red: 3>, <ColorInterp.green: 4>, <ColorInterp.blue: 5>)
Raster unit is unknown and resolution is 0.00
/-------------------------------------------/crop.definePoints('../shp/agavePoints_7p.shp') ## OrgCRS of Point Data:EPSG:4326# get point coordinates
crop.pointCoords ## Org[(-104.6026805707282, 21.488557889609346),
(-104.60290182768277, 21.488567022907),
(-104.60275177934567, 21.488441340921597),
(-104.60272718507797, 21.488446712083505),
(-104.60284817756734, 21.488475377126544),
(-104.6029300358111, 21.488499605292862),
(-104.60288397972741, 21.488506464709577),
(-104.60267744841107, 21.4884550248774),
(-104.60267523760433, 21.48846104318461),
(-104.6026923713565, 21.488474000968505),
(-104.60271024204422, 21.488489476615623),
(-104.6026697105875, 21.4884743694363)]#aprox cell diameter = 2.5m, get cell radius in meters
cellRad = int(0.00001/2//crop.rasterRes) ## Org
print(cellRad) ## Org19# ratio of analysis
crop.pointRatio = 35 ## Org
# raster band for the match template analysis
crop.selectedBand = 0.2125 * crop.redBand + 0.7154 * crop.greenBand \
+ 0.0721 * crop.blueBand ## Org
# sample row, col and array for each point
crop.getPointRowCol() ## OrgPoint N°:0 corresponds to row, col: 368, 1116
Point N°:1 corresponds to row, col: 331, 231
Point N°:2 corresponds to row, col: 834, 832
Point N°:3 corresponds to row, col: 812, 930
Point N°:4 corresponds to row, col: 698, 446
Point N°:5 corresponds to row, col: 601, 119
Point N°:6 corresponds to row, col: 573, 303
Point N°:7 corresponds to row, col: 779, 1129
Point N°:8 corresponds to row, col: 755, 1138
Point N°:9 corresponds to row, col: 703, 1069
Point N°:10 corresponds to row, col: 641, 998
Point N°:11 corresponds to row, col: 702, 1160# plant arrays
crop.plotReferenceImages() ## Org
# define object order and output raster path
#matchTemplate = crop.singleMatchTemplate(1,'../rst/matchTemplate.tif')
# plot match template
#plt.imshow(matchTemplate)#plot histogram to check theshold values
crop.singleMatchHistogram(1, interval=[0.20,0.30]) ## Org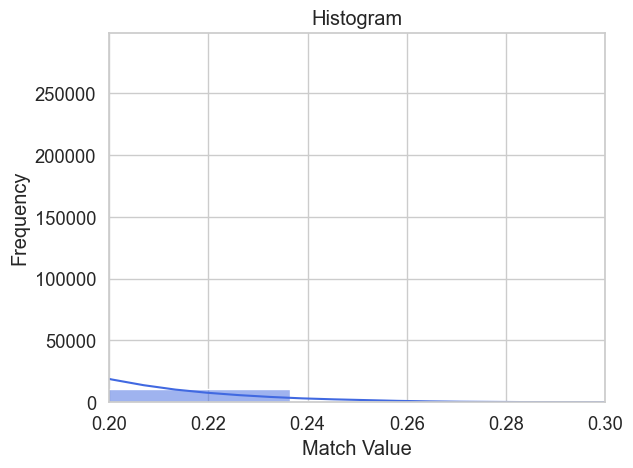
# define method (quantile or threshold) and value
crop.pointsMatchTemplate('threshold',0.25) ## Org
Processing image Nº 0
Processing image Nº 1
Processing image Nº 2
Processing image Nº 3
Processing image Nº 4
Processing image Nº 5
Processing image Nº 6
Processing image Nº 7
Processing image Nº 8
Processing image Nº 9
Processing image Nº 10
Processing image Nº 11#working with all points => takes time
# plot all templates
# crop.plotAllTemp/lates()
# save match template to a shapefile
#crop.saveMatchShp('../outShp/matchCrop.shp', limit=10000)# Birch clustering
crop.birchFilter() ## Org# plot birch points
crop.plotBirchPoints() ## Org
# save cluster points as shapefile
crop.saveBirchShp('../outShp/birchCrop.shp') ## Org
Datos de entrada
Puedes descargar los datos de entrada desde este enlace.