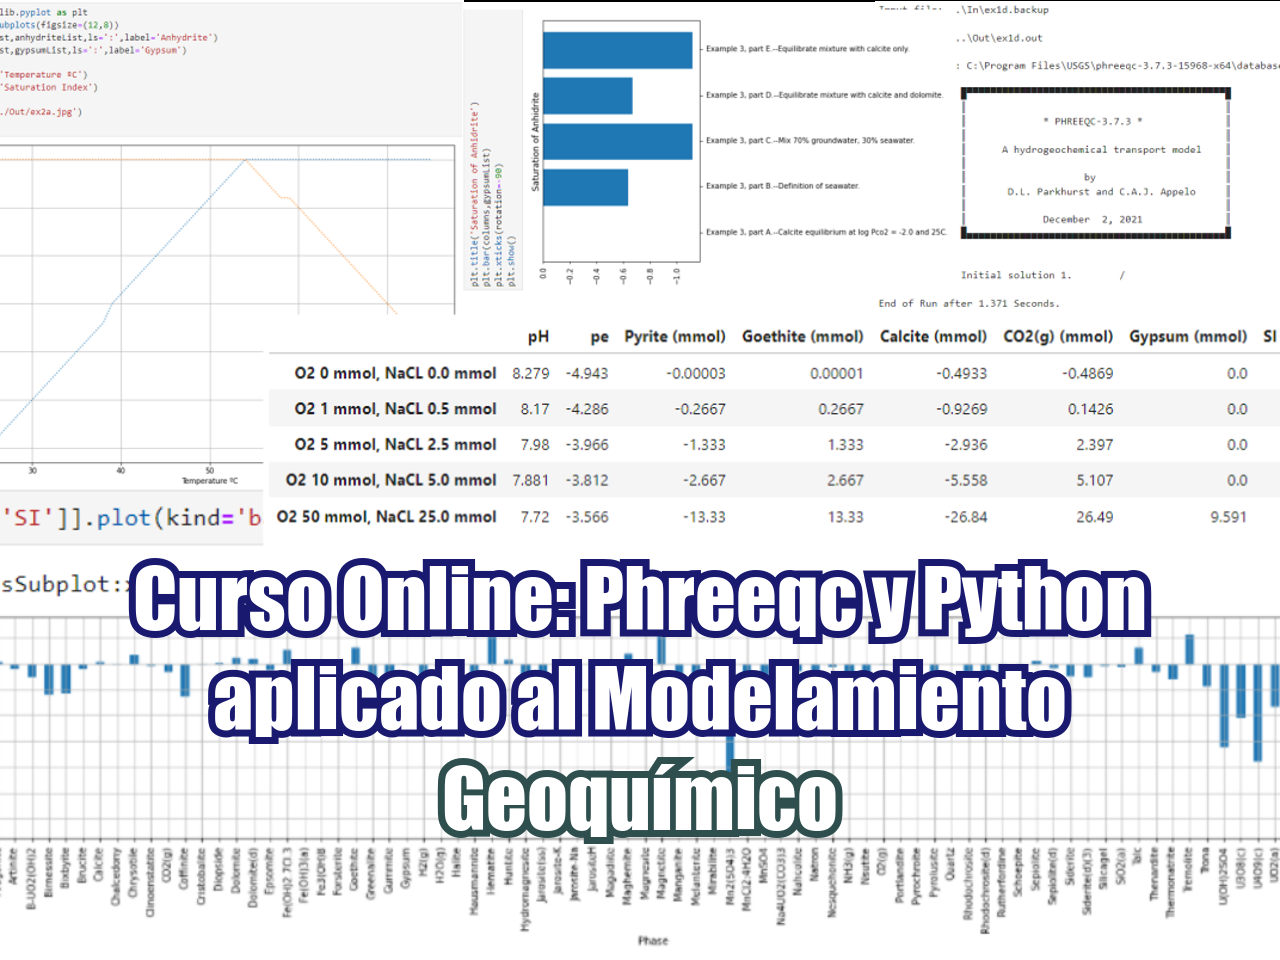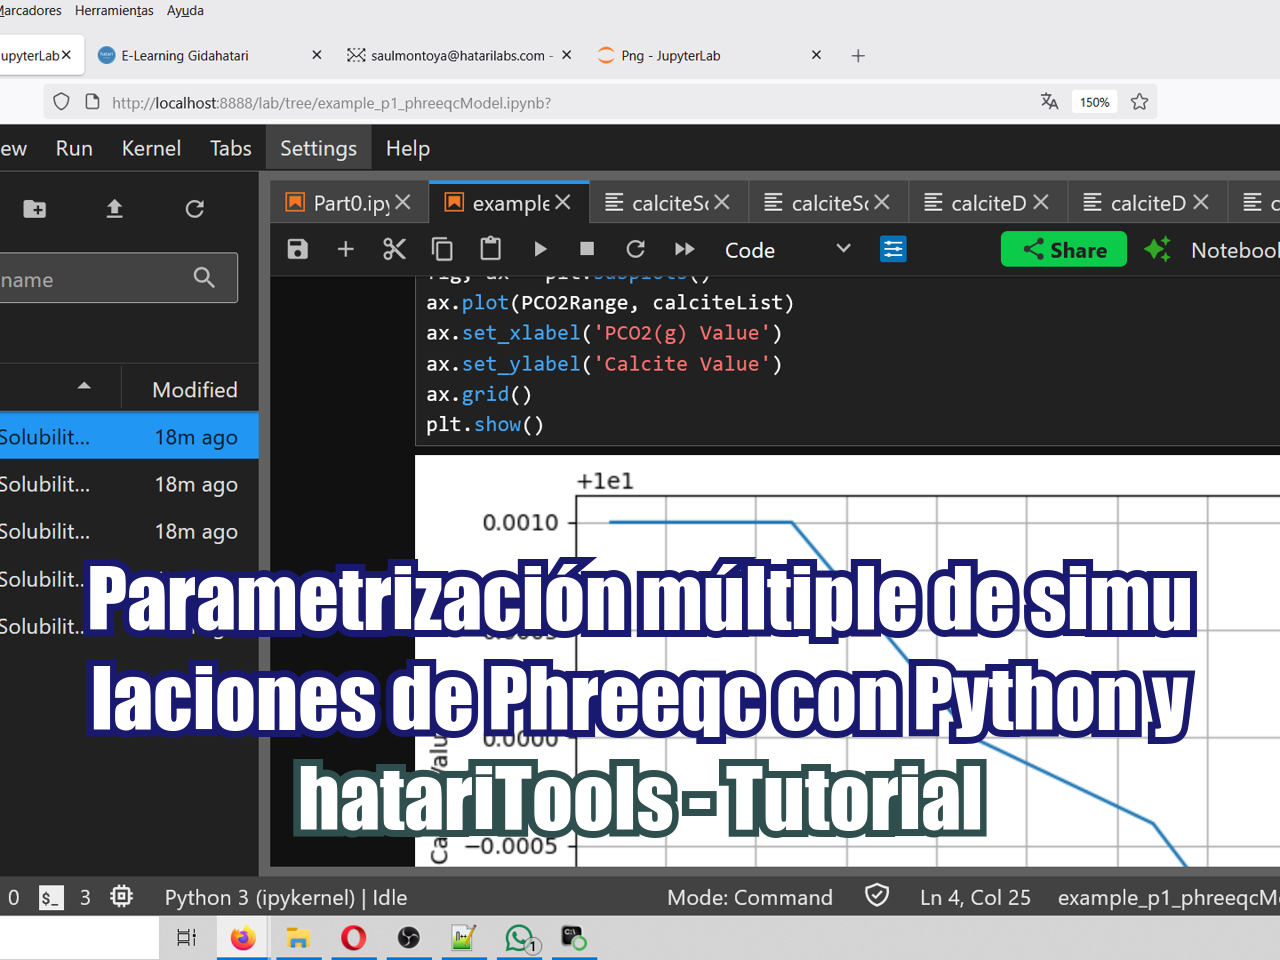
Ejemplo aplicado de simulación en Phreeqc con múltiples valores de parámetros usando Python y su nueva biblioteca hatariTools. Este ejemplo explora la simulación y el análisis de calcita a partir de diferentes valores de PCO₂(g) en un Jupyter notebook, y crea una representación gráfica de la molalidad de la calcita vs PCO₂(g) utilizando Matplotlib.
Instale hatariTools desde Anaconda con:
pip install -U hatariToolsTutorial
Phreeqc example - Speciation Calculation
Download Phreeqc batch version from this link: https://water.usgs.gov/water-resources/software/PHREEQC/index.html
Create a Phreeqc object, define executables and databse
# import required packages and classes
import os
from hatariTools.modelEngines.phrTools import phreeqcModel
from pathlib import Path
# PCO2(g) range
import numpy as np
import re
PCO2Range = np.linspace(-1.4,-3.4,5)
PCO2Rangearray([-1.4, -1.9, -2.4, -2.9, -3.4])def changeParameter(inputFile, phreeqcParam, phreeqcValue):
with open(inputFile,'r') as templateFile:
phreeqcText = templateFile.read()
phreeqcText = re.sub(phreeqcParam, str(phreeqcValue), phreeqcText)
with open('In/calciteDissolution.in','w') as workingFile:
workingFile.write(phreeqcText)changeParameter('In/calciteDissolution_CO2(g)_Template.txt',
'{{PCO2}}', '%.6f'%PCO2Range[0])def runPhreeqc():
#define the model object
chemModel = phreeqcModel()
#assing the executable and database
phPath = "C:\\Program Files\\USGS\\phreeqc-3.8.6-17100-x64"
chemModel.phBin = os.path.join(phPath,"bin\\phreeqc.bat")
chemModel.phDb = os.path.join(phPath,"database\\phreeqc.dat")
chemModel.inputFile = Path("In/calciteDissolution.in")
chemModel.outputFile = Path("Out/calciteDissolution.out")
chemModel.runModel()for PCO2Value in PCO2Range:
changeParameter('In/calciteDissolution_CO2(g)_Template.txt',
'{{PCO2}}', '%.6f'%PCO2Value)
runPhreeqc()Input file: In\calciteDissolution.in
Output file: Out\calciteDissolution.out
Database file: C:\Program Files\USGS\phreeqc-3.8.6-17100-x64\database\phreeqc.dat
█▀▀▀▀▀▀▀▀▀▀▀▀▀▀▀▀▀▀▀▀▀▀▀▀▀▀▀▀▀▀▀▀▀▀▀▀▀▀▀▀▀▀▀▀█
║ ║
║ * PHREEQC-3.8.6 * ║
║ ║
║ A hydrogeochemical transport model ║
║ ║
║ by ║
║ D.L. Parkhurst and C.A.J. Appelo ║
║ ║
║ January 7, 2025 ║
█▄▄▄▄▄▄▄▄▄▄▄▄▄▄▄▄▄▄▄▄▄▄▄▄▄▄▄▄▄▄▄▄▄▄▄▄▄▄▄▄▄▄▄▄█
Simulation 1. Initial solution 1. /
End of Run after 1.775 Seconds.#loop over selected outputs
selList = [x for x in os.listdir('Sel') if x.endswith('.sel')]
selList['calciteSolubility_-1.400000.sel',
'calciteSolubility_-1.900000.sel',
'calciteSolubility_-2.400000.sel',
'calciteSolubility_-2.900000.sel',
'calciteSolubility_-3.400000.sel']import pandas as pd
selDf = pd.read_csv('Sel/'+selList[0], delimiter='\t')
selDf| sim | soln | pH | Calcite | d_Calcite | CO2(g) | d_CO2(g) | si_Calcite | si_CO2(g) | Unnamed: 9 | |
|---|---|---|---|---|---|---|---|---|---|---|
| 0 | 1 | 1 | 6.7000 | 0.0000 | 0.00000 | 0.0000 | 0.00000 | -0.7272 | -1.3978 | NaN |
| 1 | 1 | 1 | 6.9448 | 9.9985 | -0.00153 | 9.9985 | -0.00151 | 0.0000 | -1.4001 | NaN |
calciteValue = selDf.loc[1,'     Calcite']
calciteValue9.9985def extractValues(selFile, param):
selDf = pd.read_csv('Sel/'+selFile, delimiter='\t')
selValue = selDf.loc[1,param]
return selValuecalciteList = []
for selFile in selList:
calciteList.append(extractValues(selFile,' Calcite'))
calciteList[9.9985, 9.9996, 10.0, 10.001, 10.001]import matplotlib.pyplot as plt
fig, ax = plt.subplots()
ax.plot(PCO2Range, calciteList)
ax.set_xlabel('PCO2(g) Value')
ax.set_ylabel('Calcite Value')
ax.grid()
plt.show()