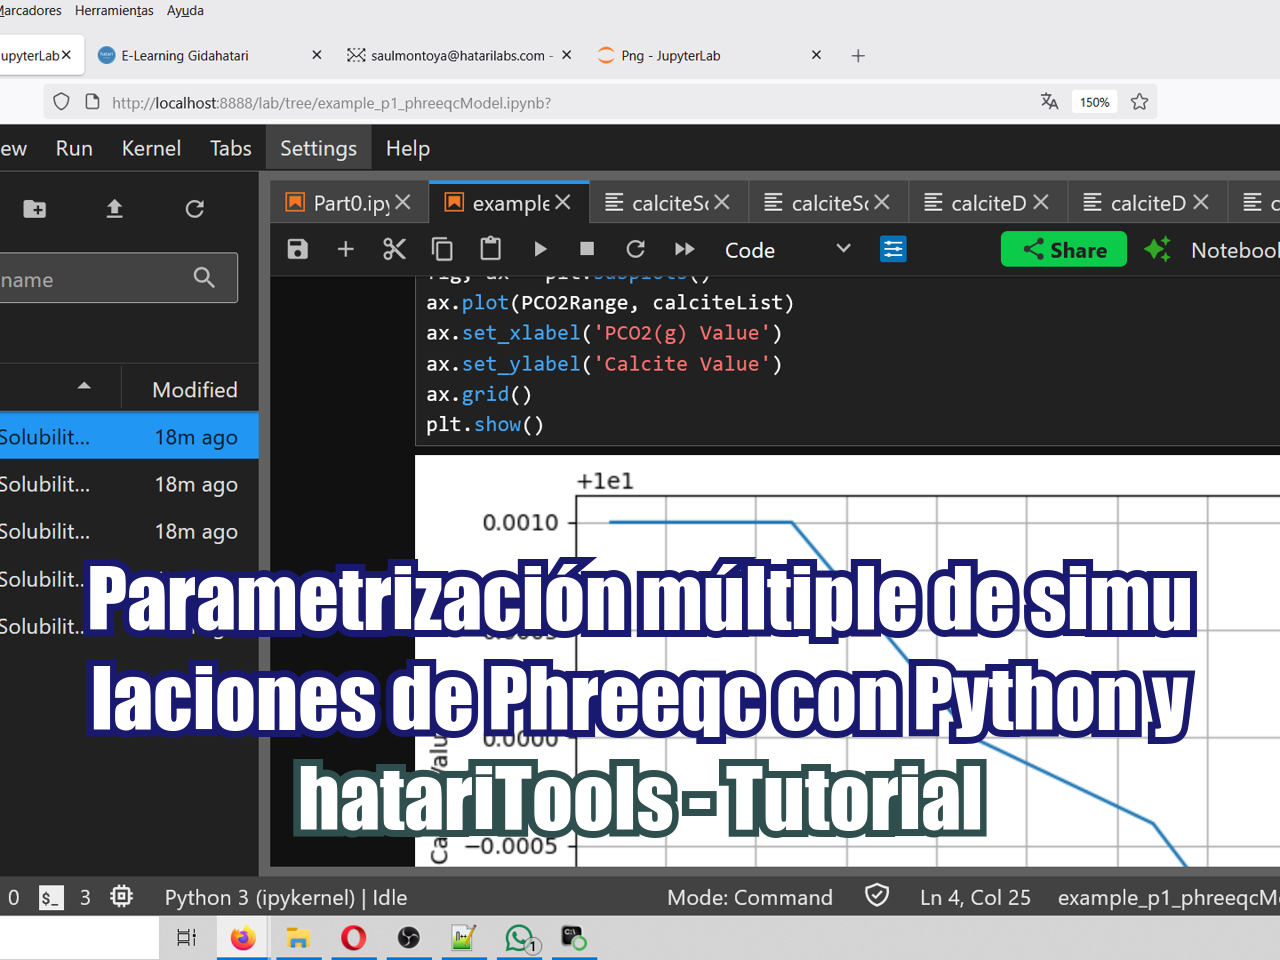
El modelamiento de especiación permite calcular la distribución de especies acuosas en una solución. Phreeqc es capaz de realizar este cálculo de especiación y vamos a demostrar esta capacidad en un caso de estudio de especies acuosas en agua de mar. El modeladamiento se realizó con un ejecutable de Phreeqc y los resultados se analizaron en un script interactivo de Julia. Ambas partes se realizaron en una sesión de Jupyter Lab.
Este caso de estudio se basa en el Ejercicio 1 de la documentación de Phreeqc.
Enlaces de software
Instale la versión por lotes de Phreeqc desde:
https://www.usgs.gov/software/phreeqc-version-3
Instalar Julia desde:
https://julialang.org/downloads/
Instale el entorno interactivo para Julia en Jupyter con estos comandos.
usando Pkg
Pkg.add ("IJulia")
Instale el paquete Dataframe para Julia:
Pkg.add ("DelimitedFiles")
¿Por qué Julia para el modelado geoquímico?
Respuesta simple, ¿por qué no? Julia es un lenguaje de programación emergente con grandes capacidades para una serie de cálculos avanzados. En nuestra perspectiva, el software tiene muchas herramientas interesantes que queremos descubrir. Hicimos este tutorial en Julia como una forma de demostrar que Julia puede trabajar en el análisis de datos hidrogeológicos / hidroquímicos.
Tutorial
Este es un video con la simulación en Phreeqc y código de análisis con Julia
Código
El código completo en Julia se muestra a continuación:
Loading packages and open file
#import require packages
import DelimitedFiles
import Plots
#open the Phreeqc output model as a array
exMat = DelimitedFiles.readdlm("../Model/ex1.out")
exMat[94:100,:]7×14 Array:
"Elements" "Molality" "Moles" … "" "" "" "" "" "" "" "" ""
"Alkalinity" 0.002406 0.002406 "" "" "" "" "" "" "" "" ""
"Ca" 0.01066 0.01066 "" "" "" "" "" "" "" "" ""
"Cl" 0.5657 0.5657 "" "" "" "" "" "" "" "" ""
"Fe" 3.711e-8 3.711e-8 "" "" "" "" "" "" "" "" ""
"K" 0.01058 0.01058 … "" "" "" "" "" "" "" "" ""
"Mg" 0.05507 0.05507 "" "" "" "" "" "" "" "" ""Analysing the solution composition
#define breakers for the solution part of the output
solutionBeg = findfirst(x->x=="-----------------------------Solution",exMat)[1]+2
solutionEnd = findfirst(x->x=="----------------------------Description",exMat)[1]-1
print("$solutionBeg, $solutionEnd")
95, 108solMat = exMat[solutionBeg:solutionEnd,1:3]
solMat[1:5,:]5×3 Array:
"Alkalinity" 0.002406 0.002406
"Ca" 0.01066 0.01066
"Cl" 0.5657 0.5657
"Fe" 3.711e-8 3.711e-8
"K" 0.01058 0.01058Plots.plot(solMat[:,1],solMat[:,2],seriestype = [:bar],legend = false)Solution composition
speciesBeg = findfirst(x->x=="----------------------------Distribution",exMat)[1]+3
speciesEnd = findfirst(x->x=="------------------------------Saturation",exMat)[1]-1
print("$speciesBeg, $speciesEnd")
133, 265#clipping entire matrix to the species distribution
speMat = exMat[speciesBeg:speciesEnd,1:7]
#replacing specific format of phreeqx
speMat[speMat.=="(0)"].=0.0
speMat[1:22,1:end]22×7 Array:
"OH-" 2.705e-6 1.647e-6 -5.568 -5.783 -0.215 -2.63
"H+" 7.984e-9 6.026e-9 -8.098 -8.22 -0.122 0.0
"H2O" 55.51 0.9806 1.744 -0.009 0.0 18.07
"C(4)" 0.002182 "" "" "" "" ""
"HCO3-" 0.001485 0.001003 -2.828 -2.999 -0.171 26.98
"MgHCO3+" 0.000256 0.000161 -3.592 -3.793 -0.201 5.82
"NaHCO3" 0.0001658 0.0001936 -3.781 -3.713 0.067 1.8
"MgCO3" 8.747e-5 0.0001022 -4.058 -3.991 0.067 -17.09
"NaCO3-" 6.682e-5 4.99e-5 -4.175 -4.302 -0.127 2.88
"CaHCO3+" 4.453e-5 3.081e-5 -4.351 -4.511 -0.16 9.96
"CO3-2" 3.752e-5 7.803e-6 -4.426 -5.108 -0.682 -1.97
"CaCO3" 2.703e-5 3.158e-5 -4.568 -4.501 0.067 -14.6
"CO2" 1.186e-5 1.385e-5 -4.926 -4.858 0.067 34.43
"UO2(CO3)3-4" 1.252e-8 1.173e-10 -7.902 -9.931 -2.028 0.0
"UO2(CO3)2-2" 1.837e-9 5.716e-10 -8.736 -9.243 -0.507 0.0
"MnCO3" 2.55e-10 2.979e-10 -9.593 -9.526 0.067 0.0
"MnHCO3+" 6.475e-11 4.294e-11 -10.189 -10.367 -0.178 0.0
"UO2CO3" 7.662e-12 8.95e-12 -11.116 -11.048 0.067 0.0
"(CO2)2" 3.015e-12 3.522e-12 -11.521 -11.453 0.067 68.87
"FeCO3" 1.796e-20 2.098e-20 -19.746 -19.678 0.067 0.0
"FeHCO3+" 1.505e-20 1.124e-20 -19.823 -19.949 -0.127 0.0
"Ca" 0.01066 "" "" "" "" ""Plots.plot(speMat[4:15,1],speMat[4:15,2],
ylabel="Species", xlabel="Molality",
seriestype = [:bar],legend = false,orientation = :h, fmt = :png)Analysis of most abundant species
#filter to eliminate rows with total molalities
speFil = speMat[speMat[:,3].!="",:]
speFil[1:10,:]
10×7 Array:
"OH-" 2.705e-6 1.647e-6 -5.568 -5.783 -0.215 -2.63
"H+" 7.984e-9 6.026e-9 -8.098 -8.22 -0.122 0.0
"H2O" 55.51 0.9806 1.744 -0.009 0.0 18.07
"HCO3-" 0.001485 0.001003 -2.828 -2.999 -0.171 26.98
"MgHCO3+" 0.000256 0.000161 -3.592 -3.793 -0.201 5.82
"NaHCO3" 0.0001658 0.0001936 -3.781 -3.713 0.067 1.8
"MgCO3" 8.747e-5 0.0001022 -4.058 -3.991 0.067 -17.09
"NaCO3-" 6.682e-5 4.99e-5 -4.175 -4.302 -0.127 2.88
"CaHCO3+" 4.453e-5 3.081e-5 -4.351 -4.511 -0.16 9.96
"CO3-2" 3.752e-5 7.803e-6 -4.426 -5.108 -0.682 -1.97#creating a mutable struct object in Julia
mutable struct Specie
Name::String
Molality::Float64
Activity::Float64
end#empty list to store the species structs
speciesList=Vector(undef, 0)
#iteration to store the solution species on the list
for row in range(1,length(speFil[3:end,1]),step=1)
push!(speciesList, Specie(speFil[row,1],speFil[row,2],speFil[row,3]))
end
speciesList[1:5]5-element Array:
Specie("OH-", 2.705e-6, 1.647e-6)
Specie("H+", 7.984e-9, 6.026e-9)
Specie("H2O", 55.51, 0.9806)
Specie("HCO3-", 0.001485, 0.001003)
Specie("MgHCO3+", 0.000256, 0.000161)#sort values by the Molality
sort!(speciesList, by=x->x.Molality, rev=true)
#get the first 10 species with higher molality
speciesList[1:10]10-element Array:
Specie("H2O", 55.51, 0.9806)
Specie("Cl-", 0.5657, 0.3568)
Specie("Na+", 0.4785, 0.3434)
Specie("Mg+2", 0.04754, 0.01372)
Specie("SO4-2", 0.01432, 0.002604)
Specie("K+", 0.0104, 0.006483)
Specie("Ca+2", 0.009634, 0.002409)
Specie("MgSO4", 0.00717, 0.008375)
Specie("MgSO4", 0.00717, 0.008375)
Specie("NaSO4-", 0.006637, 0.004482)names=String[]
molalities=Array(undef, 0)
activities=Array(undef, 0)
for row in speciesList[1:10]
push!(names, row.Name)
push!(molalities, row.Molality)
push!(activities, row.Activity)
endPlots.plot(names,molalities,seriestype = [:bar],legend=false, yaxis=:log, fmt = :png)Plots.plot(names,activities,seriestype = [:bar],legend=false,yaxis=:log, fmt = :png)Working with saturation indices
satBeg = findfirst(x->x=="------------------------------Saturation",exMat)[1]+2
satEnd = findfirst(x->x=="**For",exMat)[1]-1
print("$satBeg, $satEnd")
268, 298#clipping entire matrix to the saturation distribution
satMat = exMat[satBeg:satEnd,1:7]
satMat[1:5,:]5×7 Array:
"Anhydrite" -0.93 -5.2 -4.28 "CaSO4" "" ""
"Aragonite" 0.61 -7.73 -8.34 "CaCO3" "" ""
"Calcite" 0.75 -7.73 -8.48 "CaCO3" "" ""
"Chalcedony" -0.52 -4.07 -3.55 "SiO2" "" ""
"Chrysotile" 3.36 35.56 32.2 "Mg3Si2O5(OH)4" "" ""#creating a mutable struct object in Julia
mutable struct Saturation
Name::String
SI::Float64
logIAP::Float64
end#empty list to store saturation values
satList=Vector(undef, 0)
#loop to store the saturation values on the list
for row in 1:length(satMat[1:end,1])
push!(satList, Saturation(satMat[row,1],satMat[row,2],satMat[row,3]))
end
satList[1:5]5-element Array:
Saturation("Anhydrite", -0.93, -5.2)
Saturation("Aragonite", 0.61, -7.73)
Saturation("Calcite", 0.75, -7.73)
Saturation("Chalcedony", -0.52, -4.07)
Saturation("Chrysotile", 3.36, 35.56)#sort values by the Saturation
sort!(satList, by=x->x.SI, rev=true)
#get the first 10 species with higher saturation index (SI)
satList[1:10]10-element Array:
Saturation("Hematite", 14.17, 10.17)
Saturation("Pyrolusite", 6.97, 48.35)
Saturation("Goethite", 6.08, 5.08)
Saturation("Talc", 6.03, 27.43)
Saturation("Chrysotile", 3.36, 35.56)
Saturation("Dolomite", 2.39, -14.7)
Saturation("Manganite", 2.39, 27.73)
Saturation("Hausmannite", 1.55, 62.58)
Saturation("Sepiolite", 1.15, 16.91)
Saturation("Calcite", 0.75, -7.73)names=String[]
saturations=Array(undef, 0)
for row in satList
push!(names, row.Name)
push!(saturations, row.SI)
endPlots.plot(names[1:10],saturations[1:10],orientation = :h, seriestype = [:bar], legend=false, fmt = :png)Plots.plot(names[end-10:end],saturations[end-10:end],orientation = :h, seriestype = [:bar], legend=false,fmt = :png)Datos de entrada
Puede descargar los datos de entrada para el tutorial aquí.

