Este tutorial tiene un caso completo de análisis espacial para la extracción de datos puntuales de un ráster con Python y sus bibliotecas Geopandas y Rasterio. El procedimiento es completamente geoespacial y utiliza shapefiles y tifs como datos de entrada; el cálculo de datos se realizó en un entorno de Jupyter Lab.
Tutorial
Código
Este es el código completo en Python:
#import required libraries
%matplotlib inline
import matplotlib.pyplot as plt
import geopandas as gpd
import rasterio
from rasterio.plot import show
C:\Users\GIDA2\Anaconda3\lib\site-packages\geopandas\_compat.py:88: UserWarning: The Shapely GEOS version (3.4.3-CAPI-1.8.3 r4285) is incompatible with the GEOS version PyGEOS was compiled with (3.8.1-CAPI-1.13.3). Conversions between both will be slow.
shapely_geos_version, geos_capi_version_string#open point shapefile
pointData = gpd.read_file('Shp/pointData.shp')
print(pointData.crs)
pointData.plot()epsg:32611
<matplotlib.axes._subplots.AxesSubplot at 0x28cb7d97f08>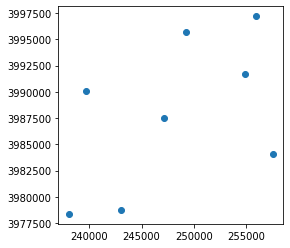
#open raster file
ndviRaster = rasterio.open('Rst/ndviImage.tiff')
print(ndviRaster.crs)
print(ndviRaster.count)
EPSG:32611
1#show point and raster on a matplotlib plot
fig, ax = plt.subplots(figsize=(12,12))
pointData.plot(ax=ax, color='orangered')
show(ndviRaster, ax=ax)<matplotlib.axes._subplots.AxesSubplot at 0x28cb90cf248>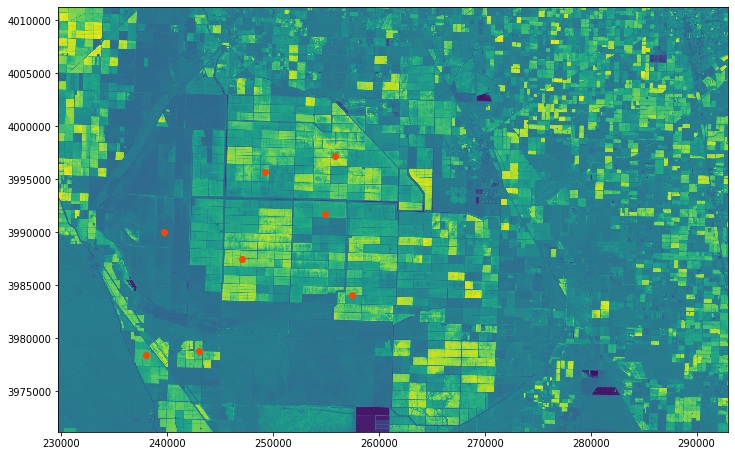
#extract xy from point geometry
for point in pointData['geometry']:
    print(point.xy[0][0],point.xy[1][0])
239728.82443269365 3990037.7658296037
249272.44019424845 3995708.972054402
247098.89419619803 3987464.4872342106
254893.6798443789 3991661.679506308
255893.01133773543 3997207.9692944367
257491.94172710588 3984091.7434441326
243001.63507343628 3978745.319954675
238054.94418132148 3978370.5706446664#extract point value from raster
for point in pointData['geometry']:
x = point.xy[0][0]
y = point.xy[1][0]
row, col = ndviRaster.index(x,y)
print("Point correspond to row, col: %d, %d"%(row,col))
print("Raster value on point %.2f \n"%ndviRaster.read(1)[row,col])Point correspond to row, col: 708, 332
Raster value on point 0.11
Point correspond to row, col: 519, 650
Raster value on point 0.34
Point correspond to row, col: 794, 578
Raster value on point 0.47
Point correspond to row, col: 654, 837
Raster value on point 0.26
Point correspond to row, col: 469, 871
Raster value on point 0.33
Point correspond to row, col: 906, 924
Raster value on point 0.44
Point correspond to row, col: 1084, 441
Raster value on point 0.26
Point correspond to row, col: 1097, 276
Raster value on point 0.36Datos de ingreso
Puede descargar los datos de ingreso de este enlace.