MODFLOW es un software que calcula las cargas hidráulicas del flujo de agua subterránea en un medio fracturado / poroso en base de una serie de condiciones de borde como recarga, evapotranspiración, drenaje, pozos, entre otros. Existen una serie de software comerciales y libres para la construcción de modelos en MODFLOW y para la representación de resultados de MODFLOW. A pesar de las capacidades de estos softwares, existe una brecha en el procesamiento de datos y la representación especialmente si hablamos de vistas isómetricas, animaciones y secciones de corte particulares que todavía siguen siendo difíciles de conseguir en modelos multicapa en condiciones transientes de múltiples periodos de requerimiento.
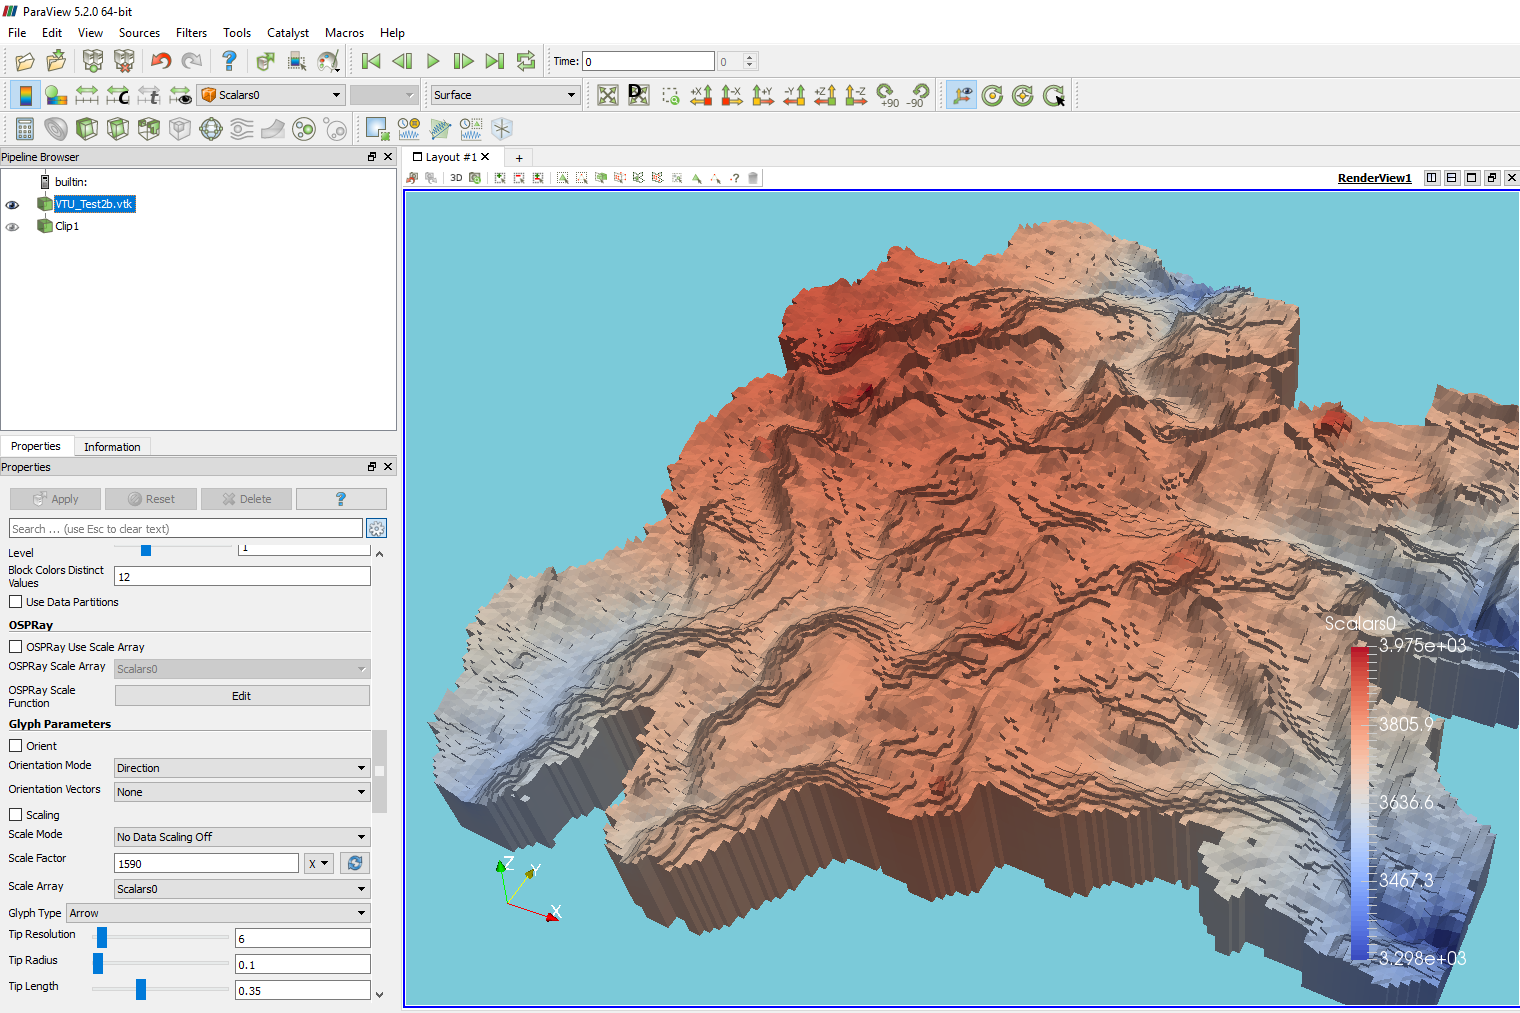
Existe un software libre que es de nuestro particular interés, este software se llama Paraview (paraview.org). Esta aplicación visual fue diseñada para analizar set de datos extremadamente largos usando recursos computacionales de memoria distribuida, es más, el término para del nombre Paraview viene de la paralelización de los núcleos de la computadora.
Este tutorial muestra el proceso completo para crear una formato de datos de geometría compatible con Paraview llamado *.vtk y su representación en Paraview. El código fue realizado en Python 3 en un Jupyter Notebook. Los datos ingresos del modelo, datos de salida y archivos del modelo se encuentran a la final de este artículo.
Tutorial
Código
Este es el código completo en Python
#import the required libraries
import os, re
import numpy as np

#change directory to the model files path
os.chdir('C:/Users\Saul\Documents\Ih_PlayaroundwithVTK\Model')

#open the *.DIS file and get the model boundaries and discretization
dis= open('Modelo1.dis').readlines()

lowerleft, upperright = re.sub('\(|\)' , ',' , dis[2]), re.sub('\(|\)' , ',' , dis[3])
lowerleft, upperright = lowerleft.split(','), upperright.split(',')

#border coordinates
xmin, ymin = float(lowerleft[1]), float(lowerleft[2])
xmax, ymax = float(upperright[1]), float(upperright[2])

#number of layers, rows and columns
nlay, nrows, ncols = int(dis[6].split()[0]), int(dis[6].split()[1]), int(dis[6].split()[2])

#grid resolution
xres, yres = (xmax-xmin)/ncols, (ymax-ymin)/nrows

#arreglo de easting y northing
eastings = np.linspace(xmin, xmax, ncols+1, endpoint=True, dtype='float32')
northings = np.linspace(ymin, ymax, nrows+1, endpoint=True, dtype='float32')

#bottom elevation of model
linebottom=[x for x in range(len(dis)) if dis[x][:8]=='CONSTANT']
bottom= float(dis[linebottom[1]].split()[1])

#lines that separate heads from a layer
breakers=[x for x in range(len(dis)) if dis[x][:8]=='INTERNAL']

#intervals among breakers
intervals = []
for i in range(len(breakers))[1:]:
    delta=breakers[i]-breakers[i-1]
    intervals.append(delta)

interval = max(set(intervals))

#counter plus a empty numpy array for model results
i=0
zmatrix = np.zeros((nlay+1,nrows+1,ncols+1))

#loop to read all the heads in one layer, reshape them to the grid dimensions and add to the numpy array
for salto in breakers[1:]:
    rowinicio = salto + 1
    rowfinal = salto + interval #here we insert the len of lines per layer
    matrixlist = []

    for linea in range(rowinicio,rowfinal,1):
        listaitem = [float(item) for item in dis[linea].split()]
        for item in listaitem: matrixlist.append(item)

    matrixarray = np.asarray(matrixlist)
    matrixarray = matrixarray.reshape(nrows,ncols)

    zmatrix[i,:-1,:-1]=matrixarray
    i+=1

#add the bottom to the zmatrix
zmatrix[nlay,:,:]=np.ones((nrows+1,ncols+1))*bottom

#complete the extreme right column and lowest row as a duplicate of the previous one
zmatrix[:,-1,:]=zmatrix[:,-2,:]
zmatrix[:,:,-1]=zmatrix[:,:,-2]

#definition of xyz points for all vertex
VTU_Points = []
for lay in range(nlay+1):
    for row in range(nrows+1):
        for col in range(ncols+1):
            xyz=[eastings[col],northings[row],zmatrix[lay, row, col]]
            #print(eastings[col],northings[row],zmatrix[lay, row, col])
            VTU_Points.append(xyz)

#empty list to store cell coordinates
listahexahedrons = []
maximos = []

#get the nodes and rows per layer
nodesxlay, nodesxrow = (ncols+1)*(nrows+1),ncols+1

#definition of cell coordinates
for lay in range(nlay):
    for row in range(nrows):
        for col in range(ncols):
            pt0 = nodesxlay*(lay+1)+nodesxrow*(row+1)+col
            pt1 = nodesxlay*(lay+1)+nodesxrow*(row+1)+col+1
            pt2 = nodesxlay*(lay+1)+nodesxrow*(row)+col+1
            pt3 = nodesxlay*(lay+1)+nodesxrow*(row)+col
            pt4 = nodesxlay*(lay)+nodesxrow*(row+1)+col
            pt5 = nodesxlay*(lay)+nodesxrow*(row+1)+col+1
            pt6 = nodesxlay*(lay)+nodesxrow*(row)+col+1
            pt7 = nodesxlay*(lay)+nodesxrow*(row)+col
            lista = [pt0,pt1,pt2,pt3,pt4,pt5,pt6,pt7]
            listahexahedrons.append(lista)

#open the *.FHD file to read the heads, beware that the script runs only on static models
hds = open('Modelo1.fhd').readlines()

#lines that separate heads from a layer
breakers=[x for x in range(len(hds)) if hds[x][:4]=='    ']

#counter plus a empty numpy array for model results
i=0
listaheads = []

#loop to read all the heads in one layer, reshape them to the grid dimensions and add to the numpy array
for salto in breakers:
    rowinicio = salto + 1
    rowfinal = salto + 2545 #here we insert the len of lines per layer
    matrixlist = []

    for linea in range(rowinicio,rowfinal,1):
        listaitem = [float(item) for item in hds[linea].split()]
        for item in listaitem: listaheads.append(item)

    i+=1

#filter hexahedrons and heads for active cells

listahexahedronsdef = []
listaheadsdef = []

for i in range(len(listaheads)):
    if listaheads[i] > -1e-10:
        listahexahedronsdef.append(listahexahedrons[i])
        listaheadsdef.append(listaheads[i])

import os
os.chdir('C:/Users\Saul\Documents\Ih_PlayaroundwithVTK')

from pyvtk import *

points = VTU_Points

vtk = VtkData(        UnstructuredGrid(points,
                         hexahedron=listahexahedronsdef,
                         ),
        CellData(Scalars(listaheadsdef)),
        'Unstructured Grid Example'
        )
vtk.tofile('VTUFiles/VTU_Test2b')
Datos de entrada
Descargue los datos de entrada de este enlace.