La información espacial está vinculada a la posición y a un sistema de referencia. Existen muchos sistemas de coordenadas en todo el mundo con diferentes unidades de longitud, proyecciones y orígenes. De alguna manera, el análisis espacial siempre está vinculado a la información almacenada en diferentes sistemas de coordenadas y tenemos que proporcionar formas efectivas de traducirlos a un CRS (sistema de referencia de coordenadas) específico.
Hemos desarrollado un tutorial para la traducción del sistema de coordenadas de puntos XY almacenados en tablas. El tutorial muestra el procedimiento para cambiar los sistemas de coordenadas de tipo geográficas y proyectadas utilizando la librería Pyproj sobre un Pandas dataframe en un Jupyter notebook.
Datos de entrada
Puede descargar todos los datos de este tutorial de este enlace.
Código
Este es el código completo en Python:
Original data from: Hydrogeologic Framework of the Treasure Valley and Surrounding Area, Idaho and Oregon; Well Data https://www.sciencebase.gov/catalog/item/5d83cf8ce4b0c4f70d06f0d3
import pandas as pd
import numpy as np
import matplotlib.pyplot as plt
Open input files
wellLoc = pd.read_csv('../inputData/TV-HFM_Wells_1Location.csv',header=1,index_col=0,usecols=[0,2,3,4,5])
wellLoc.head()| Easting | Northing | dd_lon | dd_lat | |
|---|---|---|---|---|
| Bore | ||||
| A. Isaac | 2333140.95 | 1372225.65 | -116.065033 | 43.532316 |
| A. Woodbridge | 2321747.00 | 1360096.95 | -116.201976 | 43.420553 |
| A.D. Watkins | 2315440.16 | 1342141.86 | -116.273786 | 43.257477 |
| A.L. Clark; 1 | 2276526.30 | 1364860.74 | -116.761968 | 43.451284 |
| A.L. Clark; 2 | 2342620.87 | 1362980.46 | -115.945106 | 43.451176 |
Transform coordinate system - Geographical
from pyproj import Transformer
transformer = Transformer.from_crs('epsg:4269','epsg:4326',always_xy=True)
points = list(zip(wellLoc.dd_lon,wellLoc.dd_lat))
coordsWgs = np.array(list(transformer.itransform(points)))
coordsWgs[:5,:]
array([[-116.065033, 43.532316],
[-116.201976, 43.420553],
[-116.273786, 43.257477],
[-116.761968, 43.451284],
[-115.945106, 43.451176]])wellLoc['lonWgs']=coordsWgs[:,0]
wellLoc['latWgs']=coordsWgs[:,1]
wellLoc.head()| Easting | Northing | dd_lon | dd_lat | lonWgs | latWgs | |
|---|---|---|---|---|---|---|
| Bore | ||||||
| A. Isaac | 2333140.95 | 1372225.65 | -116.065033 | 43.532316 | -116.065033 | 43.532316 |
| A. Woodbridge | 2321747.00 | 1360096.95 | -116.201976 | 43.420553 | -116.201976 | 43.420553 |
| A.D. Watkins | 2315440.16 | 1342141.86 | -116.273786 | 43.257477 | -116.273786 | 43.257477 |
| A.L. Clark; 1 | 2276526.30 | 1364860.74 | -116.761968 | 43.451284 | -116.761968 | 43.451284 |
| A.L. Clark; 2 | 2342620.87 | 1362980.46 | -115.945106 | 43.451176 | -115.945106 | 43.451176 |
Plot transformed coordinates
# with matplotlib
figure = plt.figure(figsize=(10,12))
plt.scatter(wellLoc.lonWgs, wellLoc.latWgs, s=15, c='goldenrod')
plt.show()
# with mplleaflet over a section of points
wellLocCut = wellLoc[wellLoc.lonWgs.between(-116.4,-116.0)][wellLoc.latWgs.between(43.4,43.8)]
import mplleaflet
tiles=('http://mt0.google.com/vt/lyrs=s&hl=en&x=',
'<a href=https://www.openstreetmap.org/about">© OpenStreetMap</a>')
wellCrs =
figure = plt.figure(figsize=(10,12))
plt.scatter(wellLocCut.lonWgs, wellLocCut.latWgs, s=30, c='orangered')
mplleaflet.display(crs=wellCrs,tiles=tiles)
C:\Users\Gida\Anaconda3\lib\site-packages\ipykernel_launcher.py:2: UserWarning: Boolean Series key will be reindexed to match DataFrame index.
C:\Users\Gida\Anaconda3\lib\site-packages\IPython\core\display.py:694: UserWarning: Consider using IPython.display.IFrame instead
warnings.warn("Consider using IPython.display.IFrame instead")Transform coordinate system - Transverse Mercator
from pyproj import Transformer
transformer = Transformer.from_crs('esri:102605','epsg:32611',always_xy=True)
points = list(zip(wellLoc.Easting,wellLoc.Northing))
coordsWgsUTM = np.array(list(transformer.itransform(points)))
coordsWgsUTM[:5,:]

array([[ 575546.62883411, 4820354.91361594],
       [ 564600.3665819 , 4807827.44742112],
       [ 558944.8434037 , 4789663.81991337],
       [ 519259.00615917, 4810958.61748012],
       [ 585351.15027036, 4811459.50309812]])

wellLoc['EastingUTM']=coordsWgsUTM[:,0]
wellLoc['NorthingUTM']=coordsWgsUTM[:,1]

figure = plt.figure(figsize=(10,12))
plt.scatter(wellLoc.EastingUTM, wellLoc.NorthingUTM, s=30, c='orangered')

<matplotlib.collections.PathCollection at 0x1ee319cd198>
Export CSV with transformed coordinates
### Export dataframe as CSV
wellLoc.to_csv('../outputData/TV-HFM_Wells_1Location_trans.csv')
Video
Control de proyección
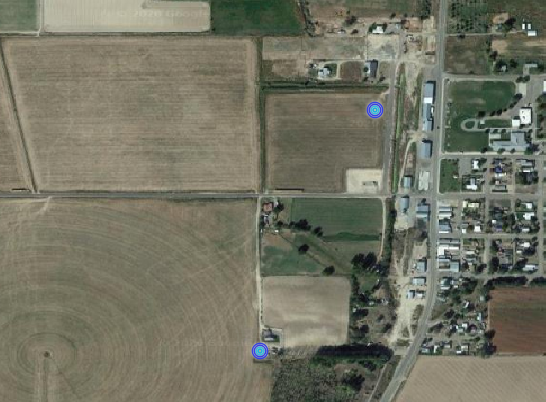
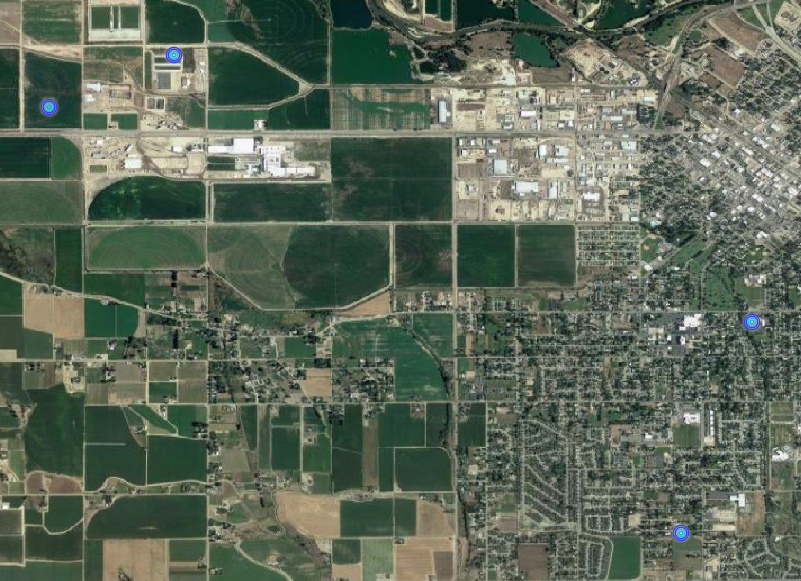
Todas las coordenadas originales y traducidas se representaron en QGIS para mostrar la precisión / idoneidad de la traducción del sistema de coordenadas. Las siguientes capturas de pantalla muestran que la ubicación del punto es la misma independientemente del sistema de coordenadas.


