El análisis geoespacial no se limita a un solo software de escritorio o un kernel de Python; si usa un análisis espacial masivo o si trabaja en un equipo que quiere un resultado espacial específico, el uso de un Rest Api puede ser conveniente. Hemos desarrollado un tutorial básico, introductorio pero claro de una Rest Api geoespacial que implementa el método Post y el método Get y devuelve el centroide de un polígono y la lista de elementos con sus coordenadas respectivamente. El tutorial se realiza en Windows, sin embargo, se espera que un servidor Rest real que ejecuta varias consultas espaciales de alta energía se ejecute en Linux.
Tutorial
Código
Este es el código del servidor Flask:
# app.py
from flask import Flask, request, jsonify
from shapely.geometry import shape
import json

app = Flask(__name__)

polygons = [
]

def _find_next_id():
    print(polygons)
    if len(polygons) > 0:
        return max(polygon["id"] for polygon in polygons) + 1
    else:
        return 1

@app.get("/centroids")
def get_countries():
    return jsonify(polygons)

@app.post("/centroids")
def add_polygon():
    if request.is_json:
        polygon = json.loads(request.get_json())
        polyCoords = polygon["features"][0]["geometry"]["coordinates"]
        polyShape = shape({
            "type": "MultiPolygon",
            "coordinates":polyCoords
            })
        polygon["centroidx"] = polyShape.centroid.x
        polygon["centroidy"] = polyShape.centroid.y
        polygon["id"] = _find_next_id()
        polygon["name"] = polygon["features"][0]["properties"]["name"]

        #remove unwanted keys
        polygon.pop("features")
        polygon.pop("type")

        polygons.append(polygon)

        return polygon, 201
    return {"error": "Request must be JSON"}, 415
Este es código que llama al servidor:
import requests, json
import folium
import geopandas as gpd
#open geospatial data
facDf = gpd.read_file('../In/schoolsHospitalsPoliceFire.gpkg')
#plot polygon
facDf.plot()<AxesSubplot:>#show dataframehead
facDf.head()| amenity | name | geometry | |
|---|---|---|---|
| 0 | school | Pioneer Elementary School | MULTIPOLYGON (((-116.34768 43.64752, -116.3475... |
| 1 | school | Centennial High School | MULTIPOLYGON (((-116.33940 43.65290, -116.3389... |
| 2 | school | Joplin Elementary School | MULTIPOLYGON (((-116.33274 43.65530, -116.3300... |
| 3 | school | Lowell Scott Middle School | MULTIPOLYGON (((-116.35409 43.65206, -116.3539... |
| 4 | school | Cecil D. Andrus Elementary School | MULTIPOLYGON (((-116.34585 43.66075, -116.3447... |
#get the first row
firstRow = facDf.loc[[0]]
type(firstRow)geopandas.geodataframe.GeoDataFrame#first row as json
rowJson = firstRow.to_json()
rowJson'{"type": "FeatureCollection", "features": [{"id": "0", "type": "Feature", "properties": {"amenity": "school", "name": "Pioneer Elementary School"}, "geometry": {"type": "MultiPolygon", "coordinates": [[[[-116.347681, 43.6475172], [-116.3475058, 43.6475166], [-116.346734, 43.6475155], [-116.3466762, 43.6475261], [-116.3466453, 43.6475518], [-116.3466085, 43.6475852], [-116.3465764, 43.6475987], [-116.3465489, 43.6476038], [-116.3465174, 43.6476076], [-116.3464713, 43.6476106], [-116.346431, 43.6476106], [-116.3463823, 43.6476086], [-116.3463207, 43.6476059], [-116.346322, 43.6474886], [-116.3444521, 43.6474892], [-116.3444149, 43.6474889], [-116.3444291, 43.6458487], [-116.3445183, 43.6458486], [-116.3477109, 43.6458464], [-116.347681, 43.6475172]]]]}}]}'#url of the rest api
apiUrl = "http://127.0.0.1:5000/centroids"#get all polygons, none to the moment
response = requests.get(apiUrl)
response.json()[{'centroidx': -116.34606811481463,
'centroidy': 43.64667797982817,
'id': 1,
'name': 'Pioneer Elementary School'},
{'centroidx': -116.33714292646543,
'centroidy': 43.65049255824704,
'id': 2,
'name': 'Centennial High School'}]#add one poly
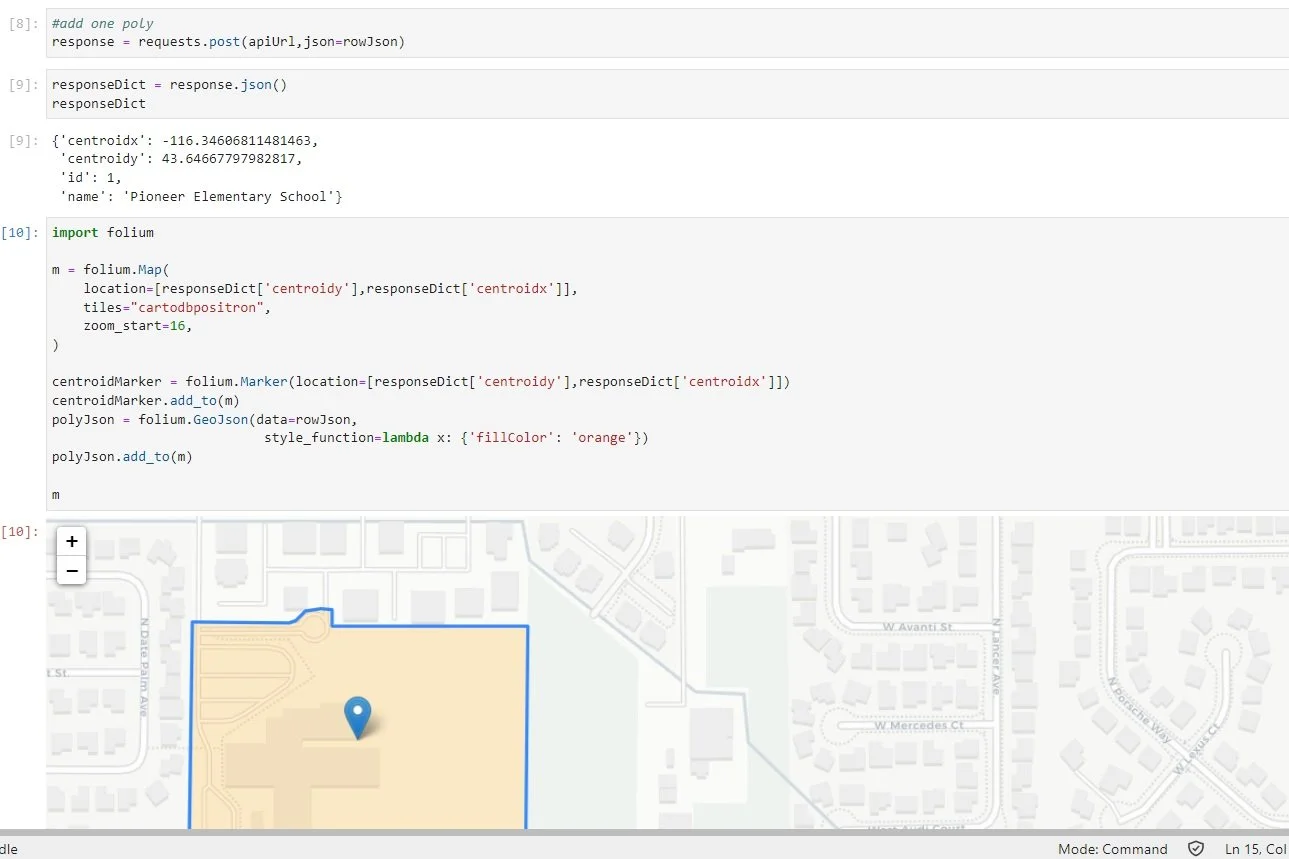
response = requests.post(apiUrl,json=rowJson)responseDict = response.json()
responseDict{'centroidx': -116.34606811481463,
'centroidy': 43.64667797982817,
'id': 3,
'name': 'Pioneer Elementary School'}import folium
m = folium.Map(
location=[responseDict['centroidy'],responseDict['centroidx']],
tiles="cartodbpositron",
zoom_start=16,
)
centroidMarker = folium.Marker(location=[responseDict['centroidy'],responseDict['centroidx']])
centroidMarker.add_to(m)
polyJson = folium.GeoJson(data=rowJson,
style_function=lambda x: {'fillColor': 'orange'})
polyJson.add_to(m)
m#get all polygons, one to the moment
response = requests.get(apiUrl)
response.json()[{'centroidx': -116.34606811481463,
'centroidy': 43.64667797982817,
'id': 1,
'name': 'Pioneer Elementary School'},
{'centroidx': -116.33714292646543,
'centroidy': 43.65049255824704,
'id': 2,
'name': 'Centennial High School'},
{'centroidx': -116.34606811481463,
'centroidy': 43.64667797982817,
'id': 3,
'name': 'Pioneer Elementary School'}]### All step involved for second polygon
#get the second row
secondRow = facDf.loc[[1]].to_json()
#url of the rest api
apiUrl = "http://127.0.0.1:5000/centroids"
#add one poly
response = requests.post(apiUrl,json=secondRow)
#get respones
responseDict = response.json()
print(responseDict['centroidx'],responseDict['centroidy'])-116.33714292646543 43.65049255824704#get all polygons, two to the moment
response = requests.get(apiUrl)
response.json()[{'centroidx': -116.34606811481463,
'centroidy': 43.64667797982817,
'id': 1,
'name': 'Pioneer Elementary School'},
{'centroidx': -116.33714292646543,
'centroidy': 43.65049255824704,
'id': 2,
'name': 'Centennial High School'},
{'centroidx': -116.34606811481463,
 'centroidy': 43.64667797982817,
 'id': 3,
'name': 'Pioneer Elementary School'},
{'centroidx': -116.33714292646543,
'centroidy': 43.65049255824704,
'id': 4,
'name': 'Centennial High School'}]
