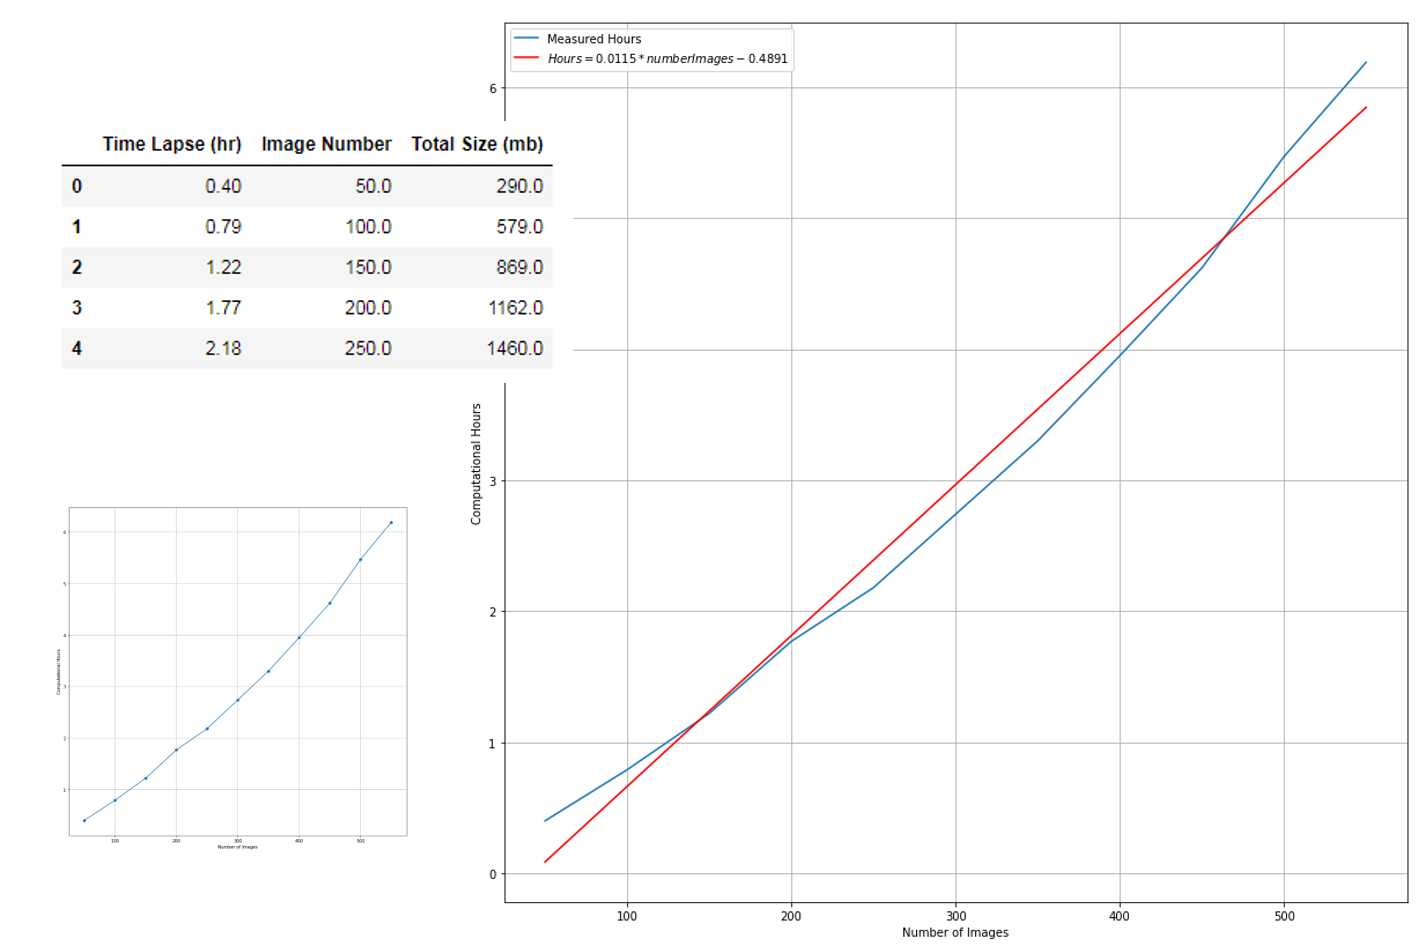
Interesante tutorial para el análisis lineal de todos los dias. Usualmente este gráfico se realiza en hojas de cálculo pero es completamente factible de realizarlo en Python en pocas líneas de código.
El trabajo con Python brinda mejores opciones de gráficos y la posibilidad de repetir el análisis con distintos set de datos.
Tutorial
Código
Este es el código en Python:
import numpy as np
import matplotlib.pyplot as plt
import pandas as pd
from sklearn.linear_model import LinearRegression
processDf = pd.read_csv('../inputData/processDf.csv')
processDf.head()| Time Lapse (hr) | Image Number | Total Size (mb) | |
|---|---|---|---|
| 0 | 0.40 | 50.0 | 290.0 |
| 1 | 0.79 | 100.0 | 579.0 |
| 2 | 1.22 | 150.0 | 869.0 |
| 3 | 1.77 | 200.0 | 1162.0 |
| 4 | 2.18 | 250.0 | 1460.0 |
fig = plt.figure(figsize=(14,14))
plt.scatter(processDf['Image Number'],processDf['Time Lapse (hr)'])
plt.plot(processDf['Image Number'],processDf['Time Lapse (hr)'])
plt.xlabel('Number of Images')
plt.ylabel('Computational Hours')
plt.grid()processDf.keys()Index(['Time Lapse (hr)', 'Image Number', 'Total Size (mb)'], dtype='object')nImages = processDf['Image Number'].values.reshape(-1,1)
Hours = processDf['Time Lapse (hr)'].values.reshape(-1,1)
linear_regressor = LinearRegression()
linear_regressor.fit(nImages, Hours)
Hours_pred = linear_regressor.predict(nImages)
Hours_predarray([[0.08681818],
[0.66272727],
[1.23863636],
[1.81454545],
[2.39045455],
[2.96636364],
[3.54227273],
[4.11818182],
[4.69409091],
[5.27 ],
[5.84590909]])#y=mx+c
m = linear_regressor.coef_[0][0]
c = linear_regressor.intercept_[0]
label = r'$Hours = %0.4f*numberImages %+0.4f$'%(m,c)
print(label)$Hours = 0.0115*numberImages -0.4891$fig = plt.figure(figsize=(14,14))
#plt.scatter(processDf['Image Number'],processDf['Time Lapse (hr)'])
plt.plot(processDf['Image Number'],processDf['Time Lapse (hr)'], label='Measured Hours')
plt.plot(nImages, Hours_pred, color='red', label=label)
plt.xlabel('Number of Images')
plt.ylabel('Computational Hours')
plt.legend()
plt.grid()

