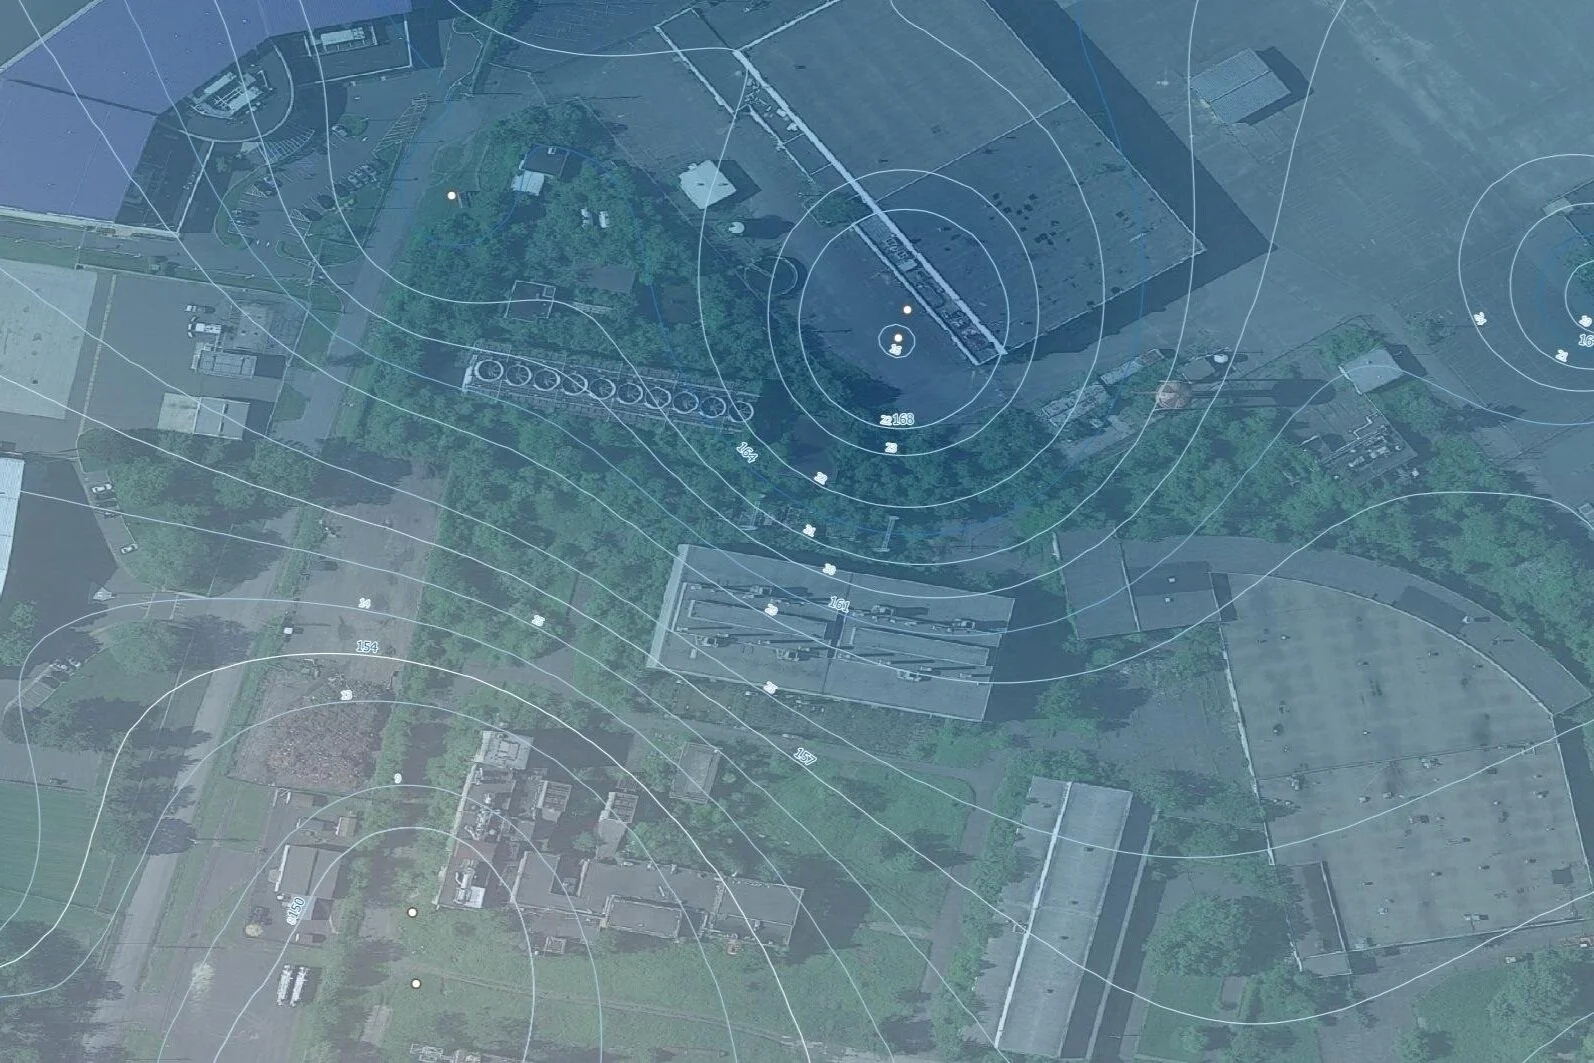
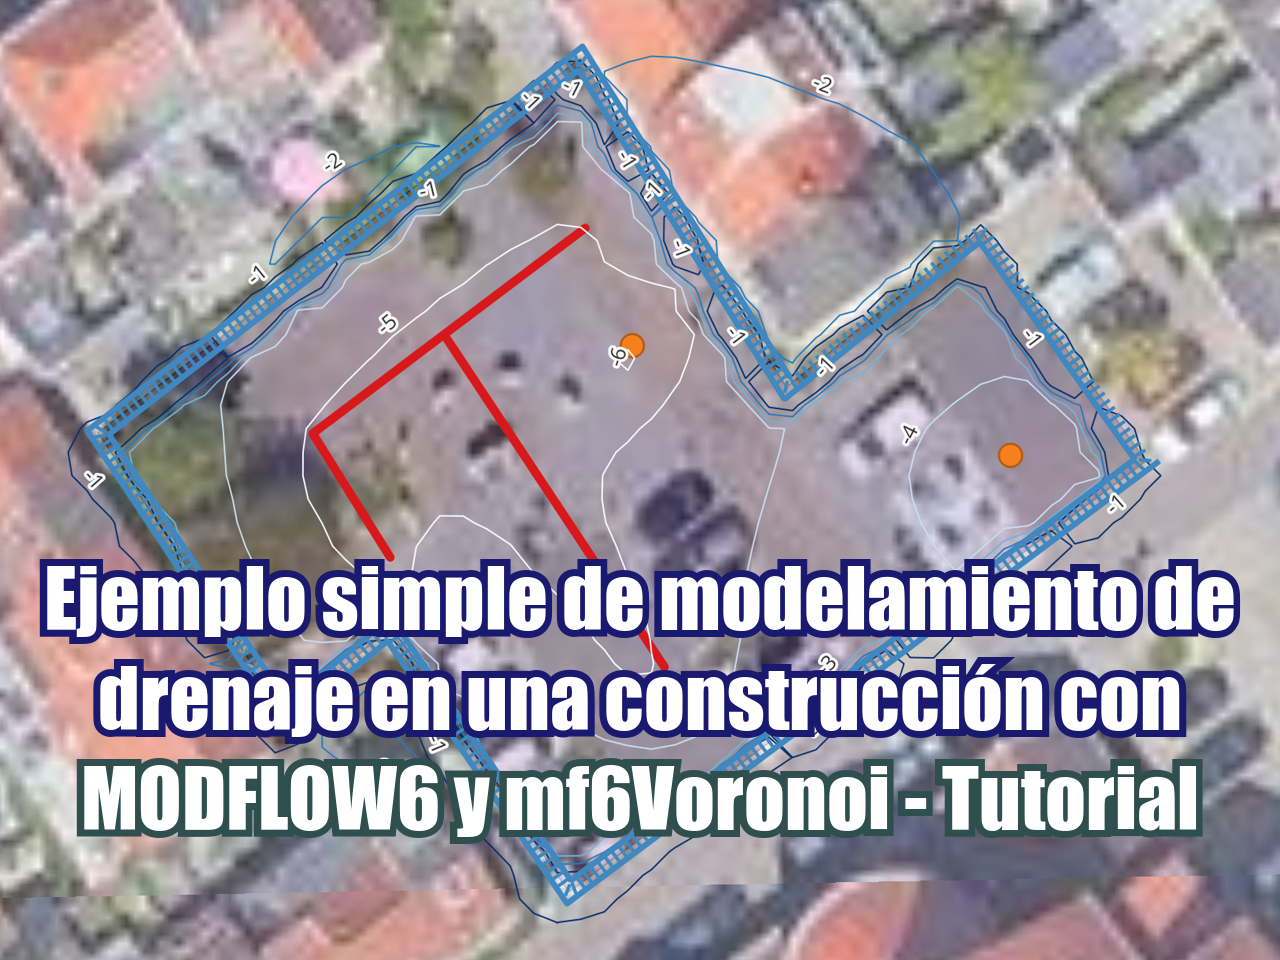
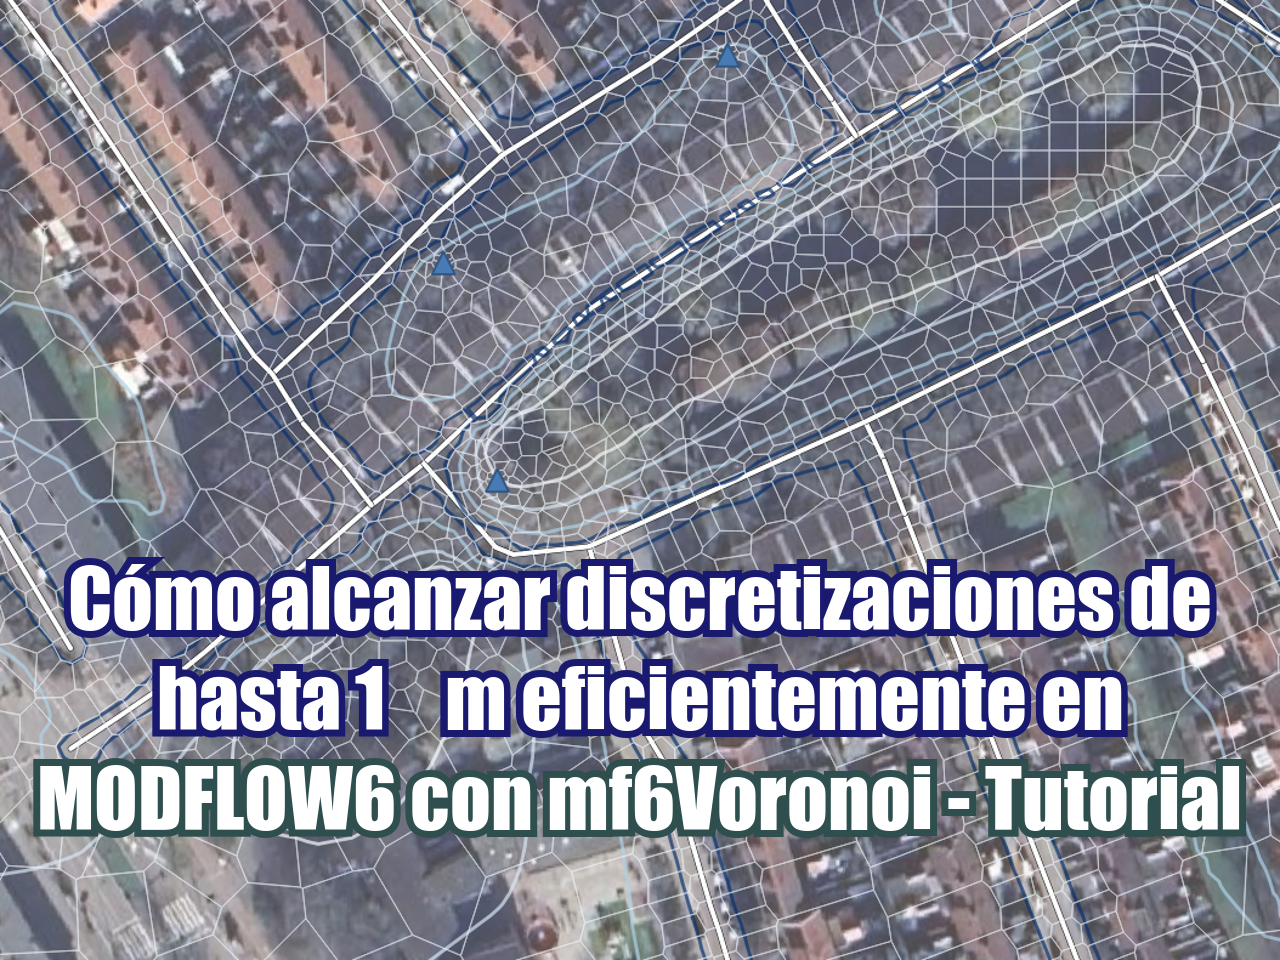
Hemos desarrollado una alternativa a un procedimiento común en SIG que consiste en crear contornos a partir de un shapefile de puntos, pero solo con comandos de Python. Mediante el uso de Python y la biblioteca GDAL podemos almacenar este proceso en una función y realizar contornos desde varios conjuntos de puntos o diferentes consultas de puntos.
El tutorial cubre dos pasos:
Paso 1: crear un ráster interpolado
Paso 2: crear contornos a partir de ráster
Se presentan dos opciones para realizar los contornos: como una descripción detallada de todos los pasos involucrados y una versión compilada del script en una función que se llama desde un Jupyter notebook.
Más información sobre las herramientas Gdal para realizar rásteres: https://gdal.org/programs/gdal_grid.html
Tutorial
Código
Este el el código paso a paso
import fiona
import numpy as np
from osgeo import osr
from osgeo import ogr
from osgeo import gdal
Step 1: Creating an interpolated raster
# open point shapefile
gwShp = fiona.open('../Shp/gwWells.shp')
# get spatial bounds
gwBounds = gwShp.bounds
gwBounds(-74.8156722, 40.2675333, -74.8083056, 40.27368889)# review attribute table for first row
gwShp[0]{'type': 'Feature',
'id': '0',
'properties': OrderedDict([('SiteNo', 401603074485301.0),
('Latitude', 40.2675333),
('Longitude', -74.8143306),
('LatLonDatu', 'NAD83'),
('SurfaceEle', 150.02),
('ElevationD', 'NAVD88'),
('HoleDepth', 48.0)]),
'geometry': {'type': 'Point', 'coordinates': (-74.8143306, 40.2675333)}}# create geospatial raster
rasterDs = gdal.Grid('../Rst/interpolatedElevations.tif', '../Shp/gwWells.shp', format='GTiff',
algorithm='invdist', zfield='SurfaceEle')
rasterDs.FlushCache()Step2: Create contours from raster
# get raster system of reference
proj = osr.SpatialReference(wkt=rasterDs.GetProjection())
proj.ExportToWkt()
'GEOGCS["NAD83",DATUM["North_American_Datum_1983",SPHEROID["GRS 1980",6378137,298.257222101,AUTHORITY["EPSG","7019"]],AUTHORITY["EPSG","6269"]],PRIMEM["Greenwich",0,AUTHORITY["EPSG","8901"]],UNIT["degree",0.0174532925199433,AUTHORITY["EPSG","9122"]],AXIS["Latitude",NORTH],AXIS["Longitude",EAST],AUTHORITY["EPSG","4269"]]'# get raster band
rasterBand = rasterDs.GetRasterBand(1)# get elevation as numpy array
elevArray = rasterBand.ReadAsArray()
print(elevArray[:4,:4])[[153.22245789 153.19668579 153.1703949 153.15008545]
[153.222229 153.19682312 153.17120361 153.15127563]
[153.22180176 153.19685364 153.17160034 153.15223694]
[153.22125244 153.19676208 153.17181396 153.15299988]]# define not a number
demNan = -32768# get dem max and min
demMax = elevArray.max()
demMin = elevArray[elevArray!=demNan].min()
print("Maximun dem elevation: %.2f, minimum dem elevation: %.2f"%(demMax,demMin))Maximun dem elevation: 175.56, minimum dem elevation: 143.39# define output shapefile
contourPath = '../shp/contoursIncremental.shp'
contourDs = ogr.GetDriverByName("ESRI Shapefile").CreateDataSource(contourPath)# define layer name and coordinate system
contourShp = contourDs.CreateLayer('contour', proj)
# define fields of id and elev
fieldDef = ogr.FieldDefn("ID", ogr.OFTInteger)
contourShp.CreateField(fieldDef)
fieldDef = ogr.FieldDefn("elev", ogr.OFTReal)
contourShp.CreateField(fieldDef)0#define number of contours and range
conNum = 10
conList =[int(x) for x in np.linspace(demMin,demMax,conNum)]# write shapefile using noDataValue
#ContourGenerate(Band srcBand, double contourInterval, double contourBase, int fixedLevelCount, int useNoData, double noDataValue,
# Layer dstLayer, int idField, int elevField
gdal.ContourGenerate(rasterBand, 0, 0, conList, 1, -32768.,
contourShp, 0, 1)
contourDs.Destroy()Este el código de llamada de la funcion
from workingTools import createContourscreateContours('../Shp/gwWells.shp', #point shapefile
'SurfaceEle', #column name
'../Rst/interpolatedElevations2.tif', #raster file
'../Shp/contoursIncremental2.shp', #contour shapefile
20)Maximun dem elevation: 175.56, minimum dem elevation: 143.39
Datos de entrada
Puede descarga los datos de entrada desde este enlace.

